the Creative Commons Attribution 4.0 License.
the Creative Commons Attribution 4.0 License.
 | 16 May 2018
Wind tunnel experiments on wind turbine wakes in yaw: redefining the wake width
Jannik Schottler
Jan Bartl
Franz Mühle
Lars Sætran
Joachim Peinke
Michael Hölling
This paper presents an investigation of wakes behind model wind turbines, including cases of yaw misalignment. Two different turbines were used and their wakes are compared, isolating effects of boundary conditions and turbine specifications. Laser Doppler anemometry was used to scan full planes of wakes normal to the main flow direction, six rotor diameters downstream of the respective turbine. The wakes of both turbines are compared in terms of the time-averaged main flow component, the turbulent kinetic energy and the distribution of velocity increments. The shape of the velocity increments' distributions is quantified by the shape parameter λ2. The results show that areas of strongly heavy-tailed distributed velocity increments surround the velocity deficits in all cases examined. Thus, a wake is significantly wider when two-point statistics are included as opposed to a description limited to one-point quantities. As non-Gaussian distributions of velocity increments affect loads of downstream rotors, our findings impact the application of active wake steering through yaw misalignment as well as wind farm layout optimizations and should therefore be considered in future wake studies, wind farm layout and farm control approaches. Further, the velocity deficits behind both turbines are deformed to a kidney-like curled shape during yaw misalignment, for which parameterization methods are introduced. Moreover, the lateral wake deflection during yaw misalignment is investigated.
- Article
(8129 KB) - Full-text XML
- Companion paper
- BibTeX
- EndNote


Due to the installation of wind turbines in wind farm arrangements, the turbine wakes become inflow conditions of downstream rotors, causing wake effects. Those include a reduced wind velocity and an increased turbulence level. The former causes power losses of up to 20 % (Barthelmie et al., 2010) in wind farms, while the latter is linked to increased loads of downstream turbines, affecting fatigue and lifetime (Burton et al., 2001). In order to mitigate wake effects, various concepts of active wake control strategies have been proposed and investigated. One concept is an active wake steering by an intentional yaw misalignment, where the velocity deficit behind a rotor is deflected laterally by misaligning it with the mean inflow direction. The possibility of wake re-direction by yawing was observed and investigated by means of numeric simulations (Fleming et al., 2014b; Jiménez et al., 2010), in wind tunnel experiments (Campagnolo et al., 2016; Medici and Alfredsson, 2006) and in full-scale field measurements by Trujillo et al. (2016). Further, the potential of increasing the power yield in a wind farm configuration has been explored experimentally (Schottler et al., 2016), numerically (Fleming et al., 2014b; Gebraad et al., 2014) and in a field test in a full-scale wind farm (Fleming et al., 2017), showing promising results as the total power yield could be increased in the mentioned studies. As the applicability of the concept to future wind farms requires a thorough understanding of the wakes behind yawed wind turbines, this study examines the wakes behind model wind turbines during yaw misalignment. Experimental studies are necessary to validate numeric results, to tune engineering models and to gain a deeper understanding of the present effects in a controlled laboratory environment. However, when examining wake effects experimentally, varying turbine models are used. Those models strongly differ in their complexity and design, including blade design, geometry or control concepts. The simplest model is a drag disc concept, where a wind turbine is modeled by a porous disk in the flow as done by España et al. (2012) and Howland et al. (2016). Moreover, rotating turbine models have been used in numerous studies, where the design and complexity of the models vary significantly. Examples include Medici and Alfredsson (2006), Bottasso et al. (2014), Abdulrahim et al. (2015), Rockel et al. (2016) or Bastankhah and Porté-Agel (2016). In contrast to numerical studies, where the vast majority of the research community uses consistent turbine models (NREL 5 MW (Jonkman et al., 2009) or DTU 10 MW (Bak et al., 2013) reference turbines for example), experiments lack certain systematics and comparability due to varying turbine models, facilities and measurement techniques. The present study aims to compare the wakes of two different model wind turbines in the same facility, using comparable boundary conditions as far as possible. In doing so, a separation between general wake effects and turbine specific observations can be achieved.
We present wake analyses ranging from mean quantities to higher-order statistics. Average mean flow components are of relevance when assessing the energy yield of potential downstream turbines. An investigation of turbulence parameters such as the turbulent kinetic energy (TKE) is linked to fluctuating inflow conditions, which is important for loads of downstream turbines and thus their lifetime (Burton et al., 2001). To gain a deeper insight, we extend our analyses to two-point statistics. More precisely, velocity increments are analyzed, allowing for a scale-dependent analysis of flows. Non-Gaussianity of the distributions of velocity increments has been reported not only in small-scale turbulence (Frisch, 1995) but also in the atmospheric boundary layer (Boettcher et al., 2003; Liu et al., 2010; Morales et al., 2012). To what extent statistical characteristics of velocity increments are transferred to wind turbines is of current interest throughout the research community (van Kuik et al., 2016). Schottler et al. (2017c) found a transfer of intermittency from wind to torque, thrust and power data in a wind tunnel experiment using a model wind turbine. Similarly, Mücke et al. (2011) found a transfer of intermittency to torque data using a generic turbine model. Milan et al. (2013) reported intermittent power data in a full-scale wind farm. We thus believe that distributions of velocity increments in wakes are of importance for potential downstream turbines as non-Gaussian characteristics are likely to be transferred to wind turbines in terms of fluctuating loads and power output. Consequently, investigations of velocity increments in wakes are extremely relevant for active wake control concepts as well as for wind farm layout optimization approaches. A further elaboration on the connection between non-Gaussian velocity increments and loads as well as power fluctuations is given in Sect. 4.
This work is organized as follows. Section 2 introduces the methods used throughout the study, including the experimental methods, a concept for quantifying a wake's deflection and a definition of the examined parameters. Section 3 shows the results of the study. First, results of the non-yawed rotors are investigated and compared in Sect. 3.1. Wakes during yaw misalignment are analyzed in Sect. 3.2, including a quantification of the wake deflection. Section 4 discusses the findings before Sect. 5 summarizes this work and states the conclusions. This work is part of a joint experimental campaign by the Norwegian University of Science and Technology (NTNU) in Trondheim and ForWind in Oldenburg, Germany. While this paper compares the wakes behind two different model wind turbines, a second paper by Bartl et al. (2018) examines the influence of varying inflow conditions on the wake of one model wind turbine.
2.1 Experimental methods
The experiments were performed in the wind tunnel of the NTNU in Trondheim, Norway. The closed-loop wind tunnel has a closed test section of 2.71 m × 1.81 m × 11.15 m (width × height × length). The inlet to the test section was equipped with a turbulence grid having a solidity of 35 % and a mesh size of 0.24 m. Further details on the grid are described by Bartl and Sætran (2017).
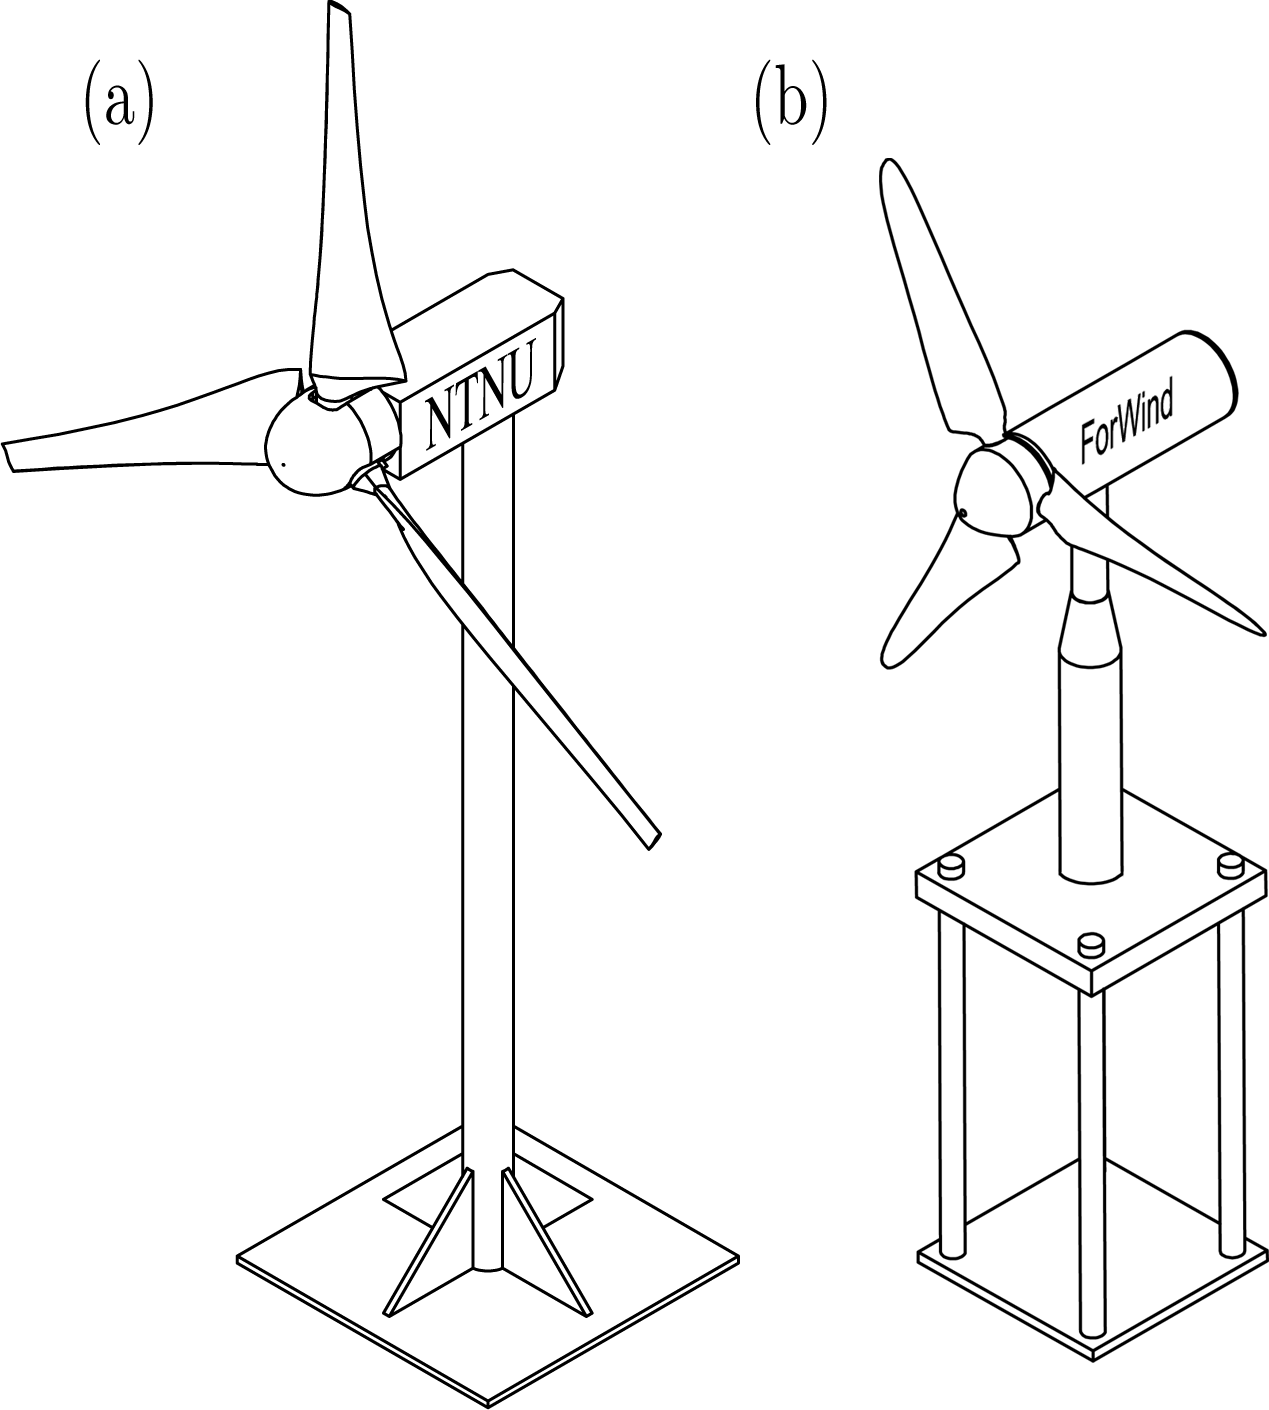
Two different model wind turbines were used that vary in geometry, blade design and direction of rotation. Those deliberate distinctions allow for an isolation of general effects of wake properties. The turbines will be denoted NTNU and ForWind. Table 1 summarizes the main features and differences of both turbines, further details are described by Schottler et al. (2017b). Figure 1 shows technical drawings. As can be seen, the ForWind turbine was placed on four cylindrical poles to lift the rotor above the wind tunnel boundary layer to a hub height of 820 mm above the wind tunnel floor.
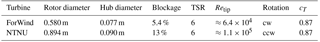
Table 1Summary of main turbine characteristics. The tip speed ratio (TSR) is based on the free-stream velocity uref at hub height. The Reynolds number at the blade tip, Retip, is based on the chord length at the blade tip and the effective velocity during turbine operation. For the ForWind turbine, 0.96 R was chosen as the radial position to account for the rounded blade tips. The blockage corresponds to the ratio of the rotor's swept area to the wind tunnel's cross-sectional area. The direction of rotation refers to observing the rotor from upstream, with (c)cw meaning (counter)clockwise. The thrust coefficients were measured at γ=0∘ and corrected for thrust on the tower and support structure.
One turbine at a time was placed on a turning table allowing for yaw misalignment, denoted by the angle γ, which is positive for a clockwise rotation of the rotor when observed from above as sketched in Fig. 2.
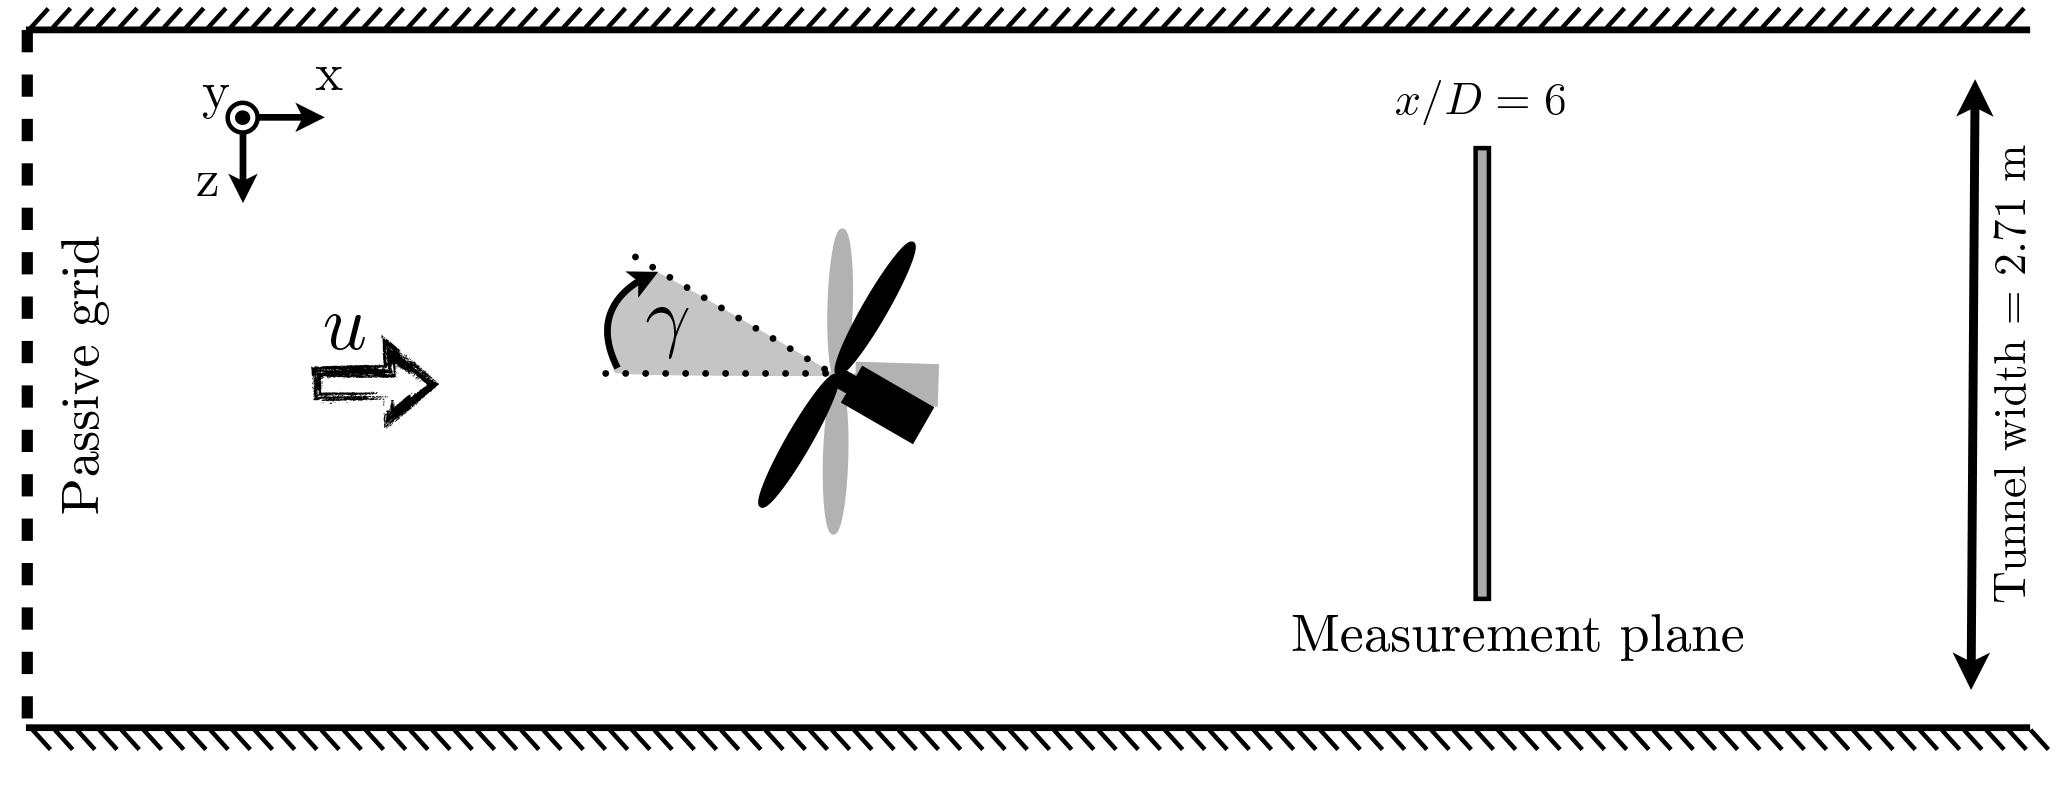
Figure 2Sketch of the setup, top view. D denotes the respective rotor diameter as listed in Table 1.
For the NTNU turbine, the reference velocity measured in the empty wind tunnel was m s−1 at a turbulence intensity of TI . For the ForWind turbine, the inflow velocity was 7.5 m s−1 and TI =0.05. In both cases, u(t) was homogeneous within ±6 % and the TI within ±3 % on a vertical line at the turbine's position.
In this study we consider two-dimensional cuts through the wake, normal to the main flow direction at a downstream distance of for both turbines as illustrated in Fig. 2. Data were acquired using a Dantec FiberFlow two-component laser Doppler anemometer (LDA) system, recording the u and v component of the flow. The accuracy is stated to be 0.04 % by the manufacturer. During turbine operation, the LDA system was traversed in the y–z plane, normal to the main flow direction. Each measured plane consists of 357 points, 21 in the z direction ranging from −D to +D and 17 points in the y direction ranging from −0.8 D to 0.8 D; see Fig. 3. The resulting distance separating two points of measurement is thus 0.1 D. For one location, 5×10⁴ samples were recorded, resulting in time series of varying lengths of approximately 30 s. As can be seen, the NTNU turbine has a slimmer tower and nacelle relative to its rotor diameter than the ForWind turbine.
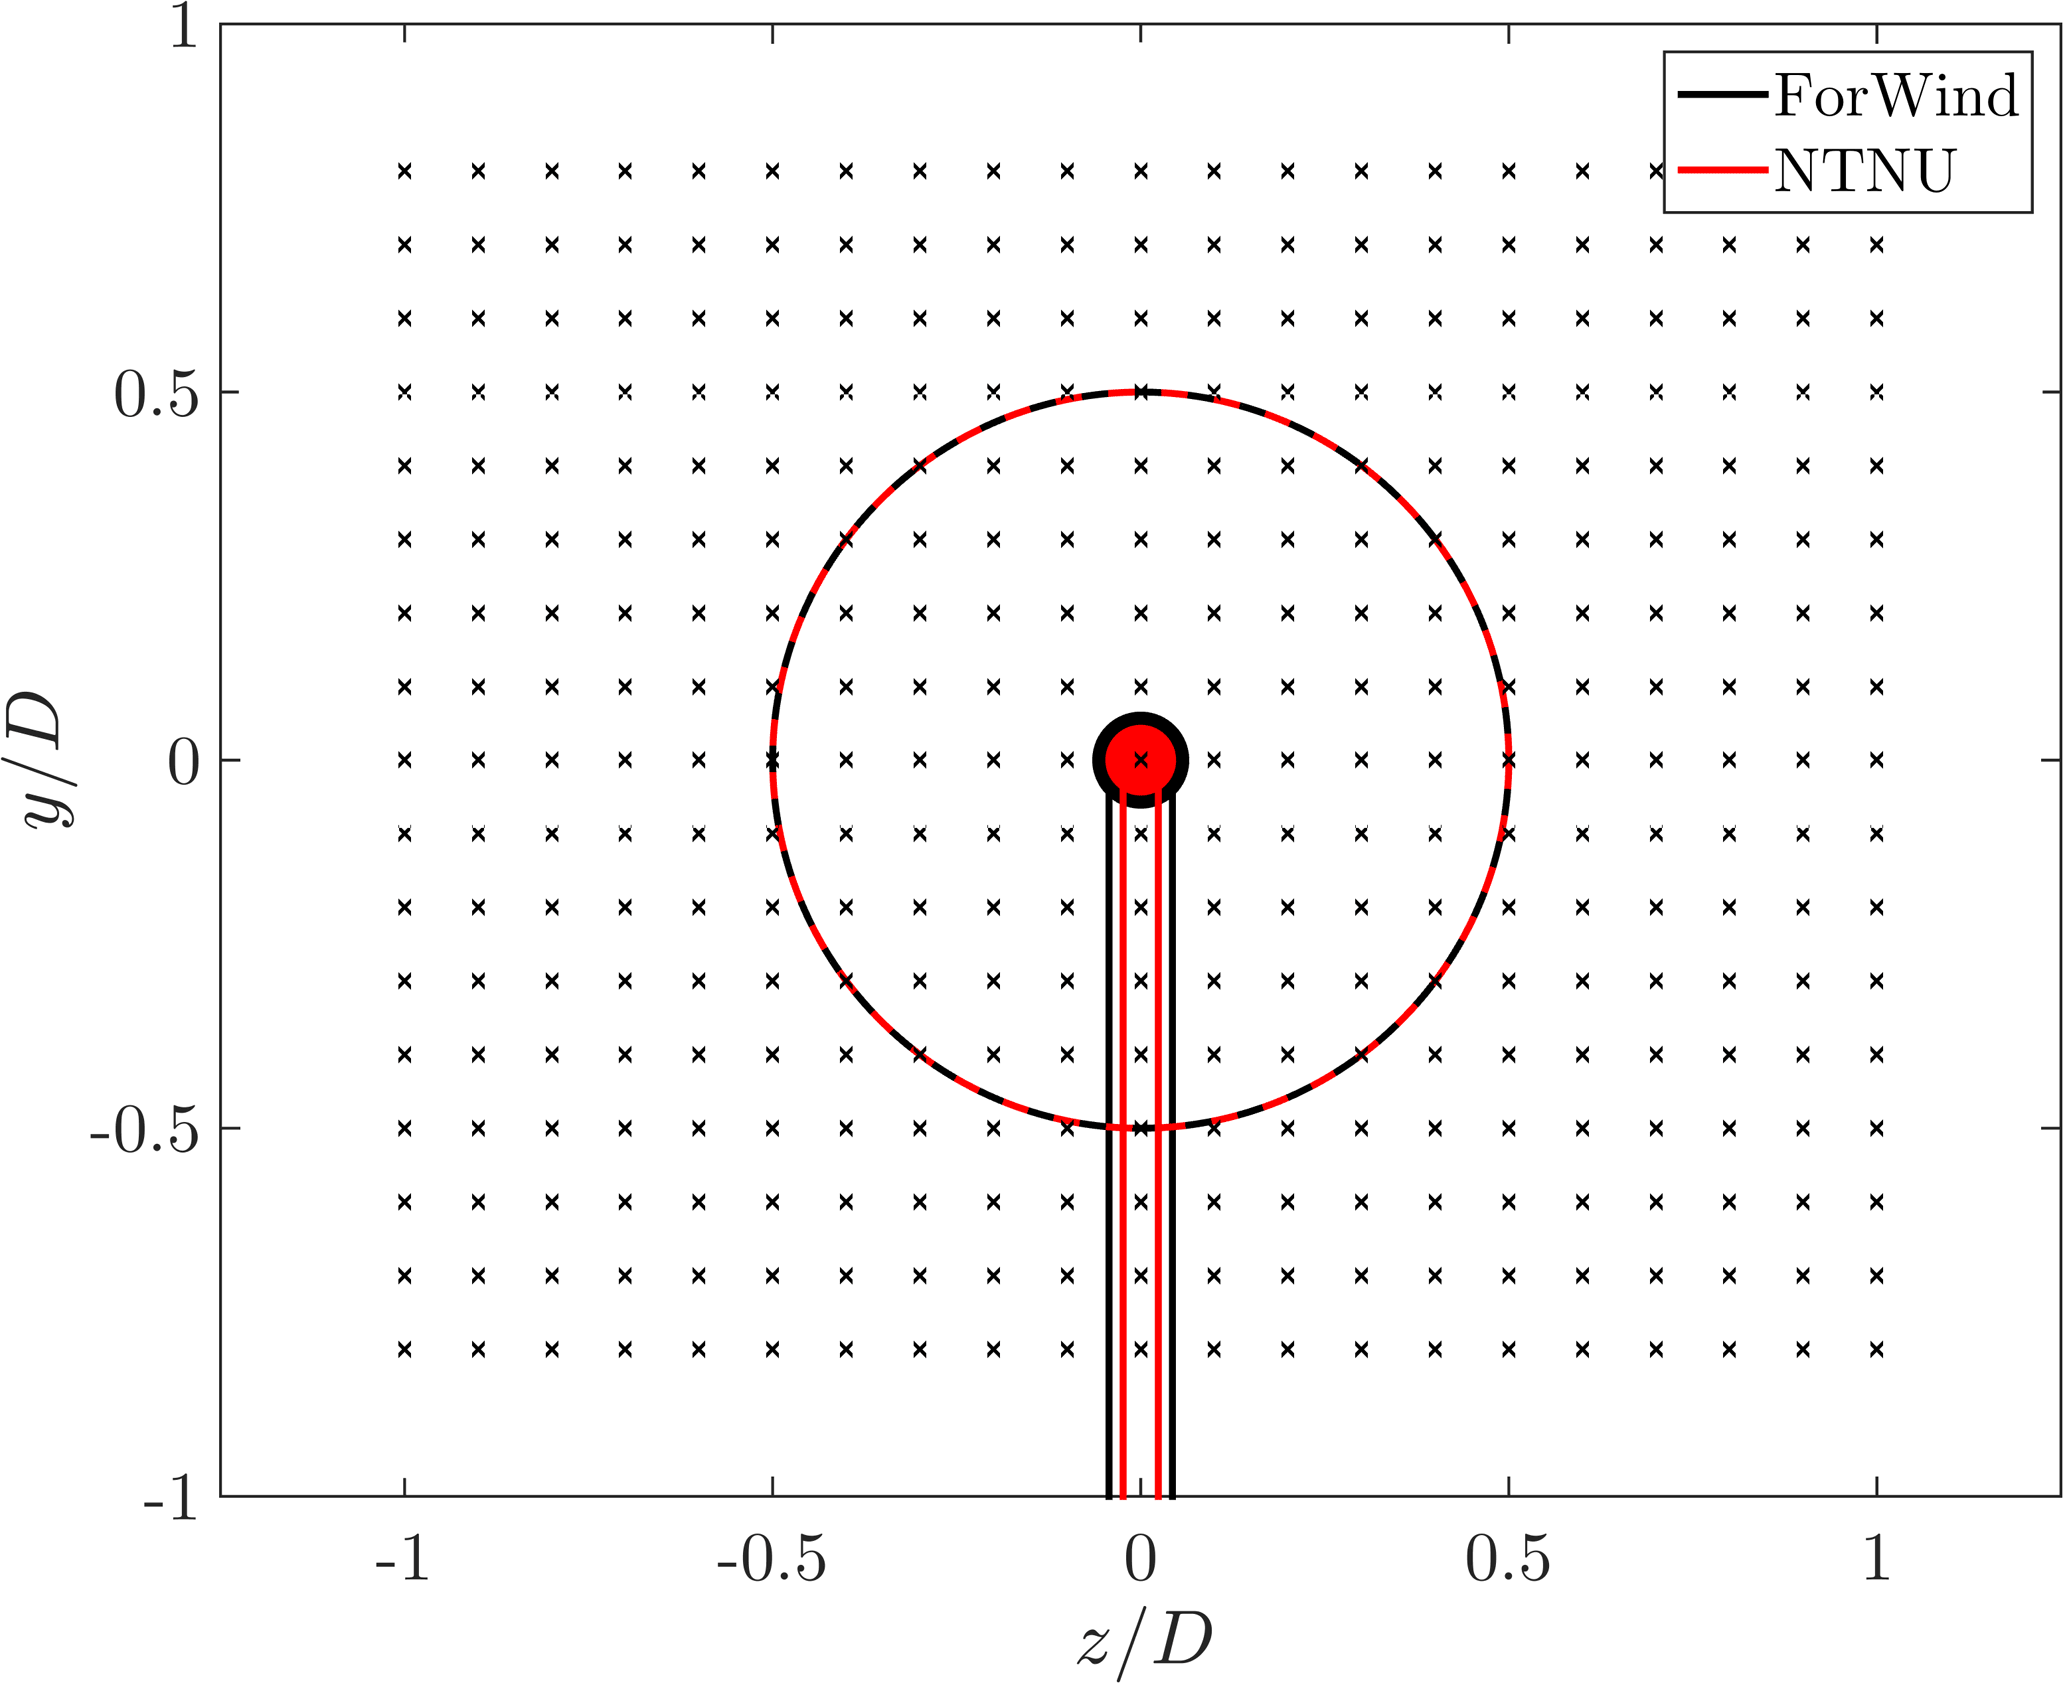
Figure 3Non-dimensional measurement grid behind the rotor for γ=0∘. The respective contours of the turbines are shown in black (ForWind) and red (NTNU). For the NTNU turbine the wind tunnel walls are located at and ; for the ForWind turbine they are located at and .
The grid of physically measured values was interpolated to a grid of 129 000 points for further analyses. The distance between the interpolated grid points is thereby reduced to 0.005 D. Natural neighbor interpolation is used, resulting in a smoother approximation of the distribution of data points (Amidror, 2002).
2.2 Wake center detection
In order to quantify the lateral wake position, we compute the power of a potential downstream turbine as described by Schottler et al. (2017b). A similar approach was shown by Vollmer et al. (2016). We define the potential power of a downstream turbine to be
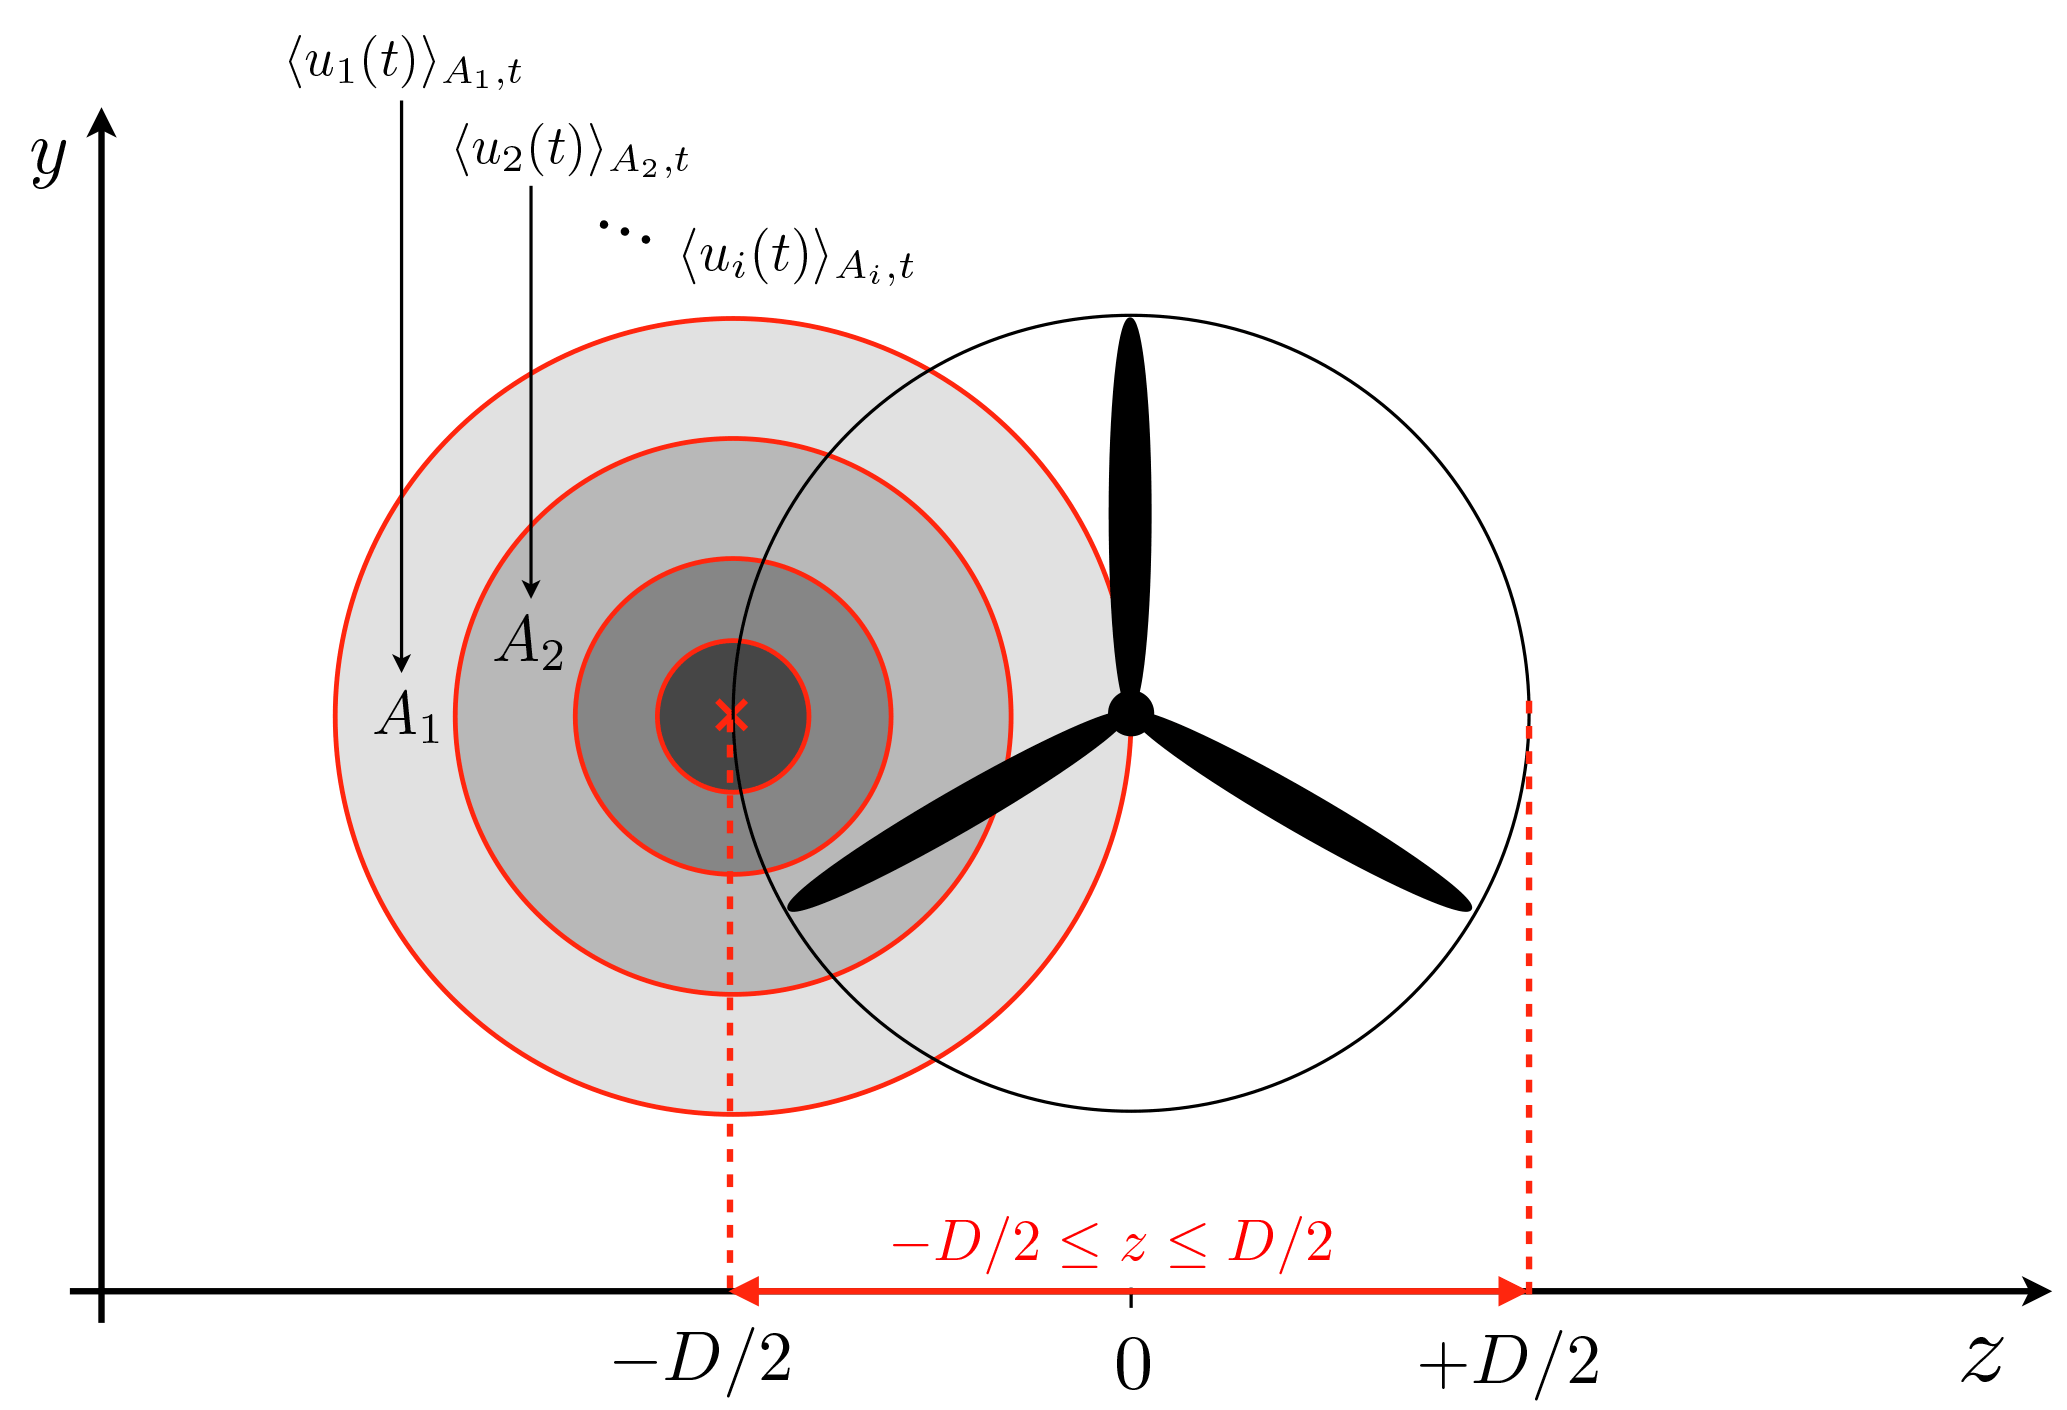
Figure 4Illustration of the wake center detection method. The hub of a potential downstream turbine is located at the red ×. is the spatially and temporarily averaged u component of the velocity. The potential power P* is calculated for each ring segment and then added up. This procedure is repeated for 50 horizontal hub locations ×, while the position resulting in the lowest value of P* is interpreted as the wake center.
The rotor area is divided into 10 ring segments. Ai is the area of the ith ring segment, and denotes the temporally and spatially averaged velocity in mean flow direction within the area Ai. P* is estimated for 50 different hub locations in the range , at hub height. We define the horizontal wake center as the z position resulting in the minimum of P*. The procedure is illustrated in Fig. 4.
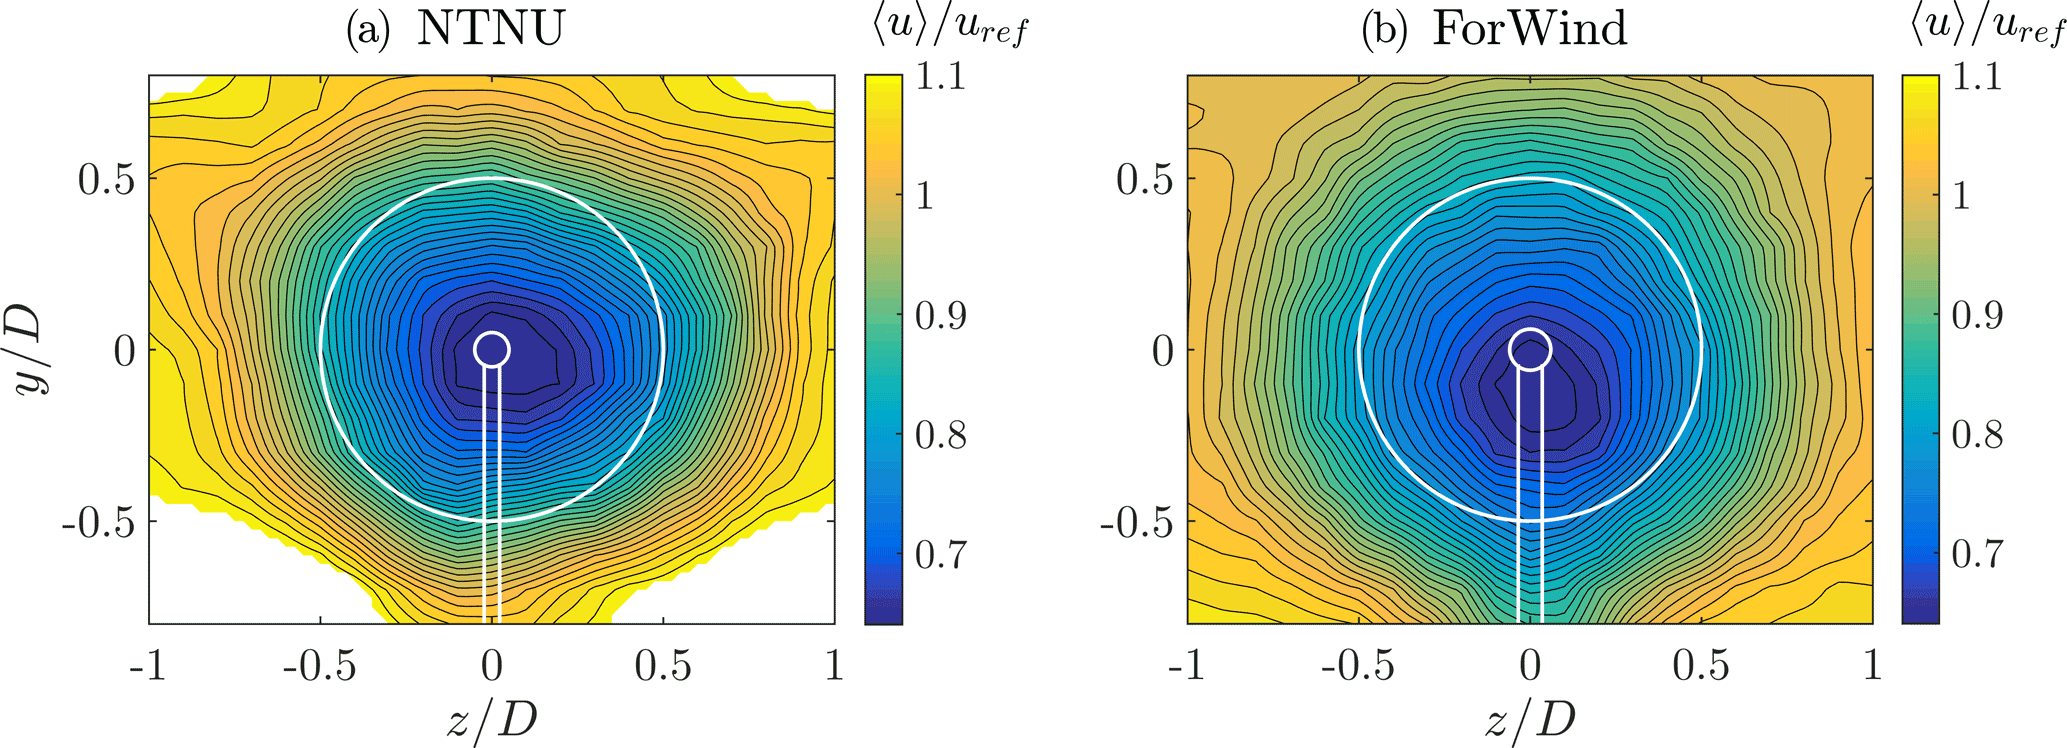
Figure 5〈u〉∕uref at γ=0∘ for the NTNU turbine (a) and ForWind turbine (b). The white lines indicate the contours of the respective turbine. Values exceeding are masked.
2.3 Examined quantities
TKE is defined by the fluctuations of the three velocity components as
where u′(t) is the fluctuation around the mean of u(t) so that
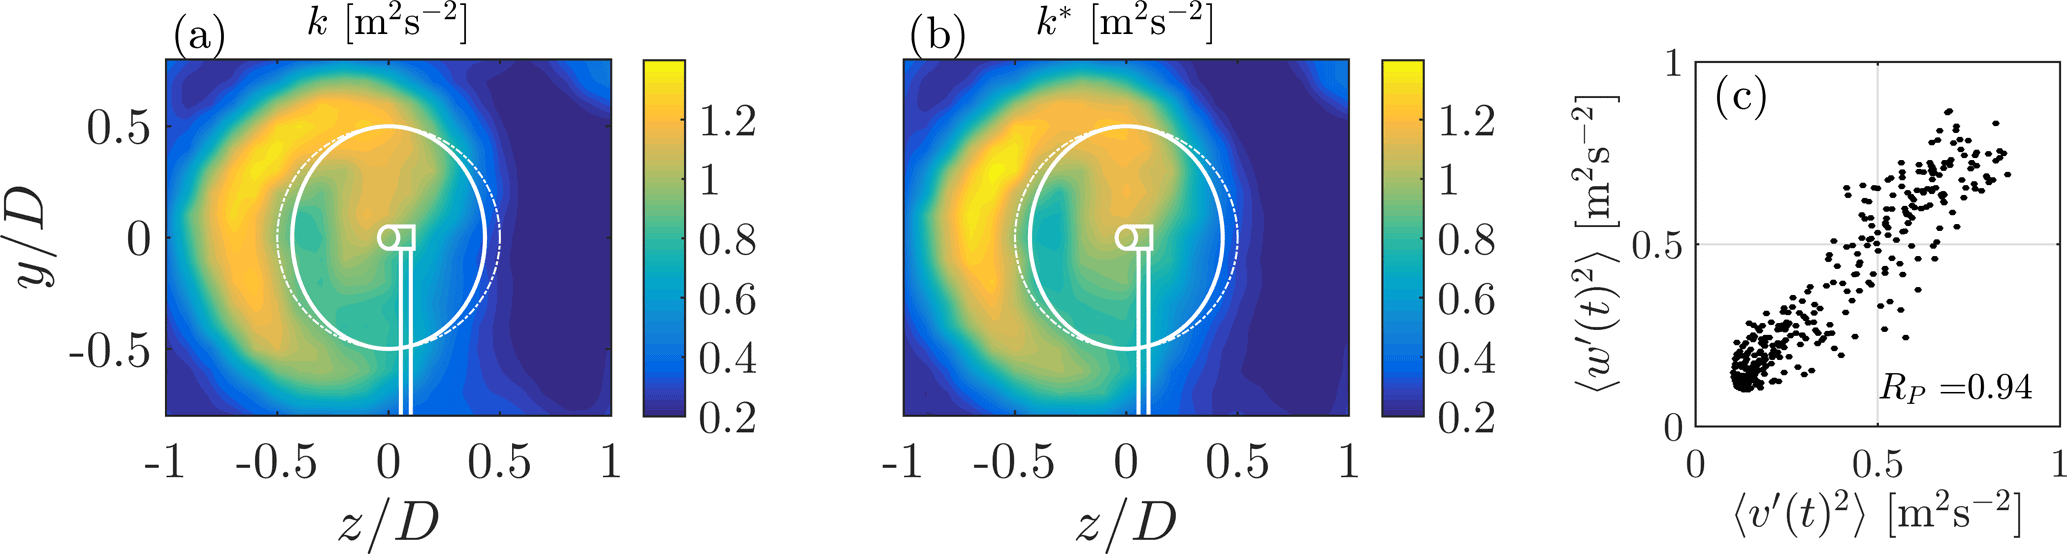
For briefness, we write 〈u〉 instead of 〈u(t)〉. As the third flow component w was not recorded, we assume so that Eq. (2) becomes
which will be used in further analyses. This approximation is discussed in Sect. 4 and supported by Fig. 15. For a thorough analysis of the wake turbulence, we examine velocity changes during a time lag τ and refer to them as velocity increments:
Investigating their probability density function (PDF) allows for scale-dependent analyses of turbulent flows, including all higher-order moments of uτ, and hence all structure functions of order n, of a velocity time series (Frisch, 1995). The impact of certain properties of velocity increment PDFs on wind turbines is to date a widely discussed topic in wind energy research (Berg et al., 2016; Milan et al., 2013; Mücke et al., 2011; Schottler et al., 2017c). For more details, we refer the reader to Morales et al. (2012) or Schottler et al. (2017c). Following Chillà et al. (1996), the shape parameter
is used to quantify the shape of the distribution p(uτ). F(uτ) is the flatness of the time series of velocity increments:
Equation (6) becomes zero for a Gaussian distribution; larger values correspond to broader, more heavy-tailed PDFs.
λ2 is of practical relevance as it provides an analytical expression for the shape of p(uτ). A discussion about the interpretation is given in Sect. 4. In this analysis, we compute λ2 for timescales τ that relate to the rotor diameter D of the respective turbine. Using Taylor's hypothesis of frozen turbulence (Mathieu and Scott, 2000), the length scale r=D is converted to the timescales τ:
whereas 〈u〉 refers to the respective time series, resulting in varying values of τ within a wake. In order to compute uτ(t) using Eq. (5), evenly spaced data are needed. The procedure applied to uniformly resample the non-uniform LDA data is described in Appendix A. The approach results in a constant sampling rate for each wake.
3.1 The non-yawed wakes
At first, we investigate wakes without yaw misalignment, γ=0∘. Figure 5 shows the contour plots of the velocity component in mean flow direction 〈u〉∕uref for both turbines 6D downstream.
The velocity deficits behind both turbines show a circular shape as expected, exceeding the rotor area, indicating a slight wake expansion. For both wakes, the minimum velocity is . Besides those general similarities, some differences are apparent. Both graphs show the tower wake, which is more strongly pronounced for the ForWind turbine. This can be explained by the larger tower diameter relative to the rotor diameter as shown in Fig. 3. Similarly, the four poles the ForWind turbine is placed on (cf. Fig. 1) are likely to enhance this effect. Figure 5 also reveals that the wake behind the ForWind turbine is slightly displaced vertically towards the ground. This effect can be linked to the tower wake, creating an uneven vertical transport of momentum as recently demonstrated by Pierella and Saetran (2017). Next, the NTNU wake shows areas of velocities exceeding at the edges of the velocity deficit, especially in the corners of the contour plot. Very likely, this is a blockage effect as the measurement plane is significantly larger for the NTNU turbine, having a higher blockage ratio (13 % for the NTNU rotor, 5.4 % for the ForWind rotor). As suggested by Chen and Liou (2011), blockage effects are expected for a cross-sectional blockage ratio exceeding 10 % when using model wind turbines, which is confirmed here for wake velocities. In order to better compare both contour plots, values exceeding are masked. To further analyze the wake flows, Fig. 6 shows the contour plots of the TKE behind both turbines.
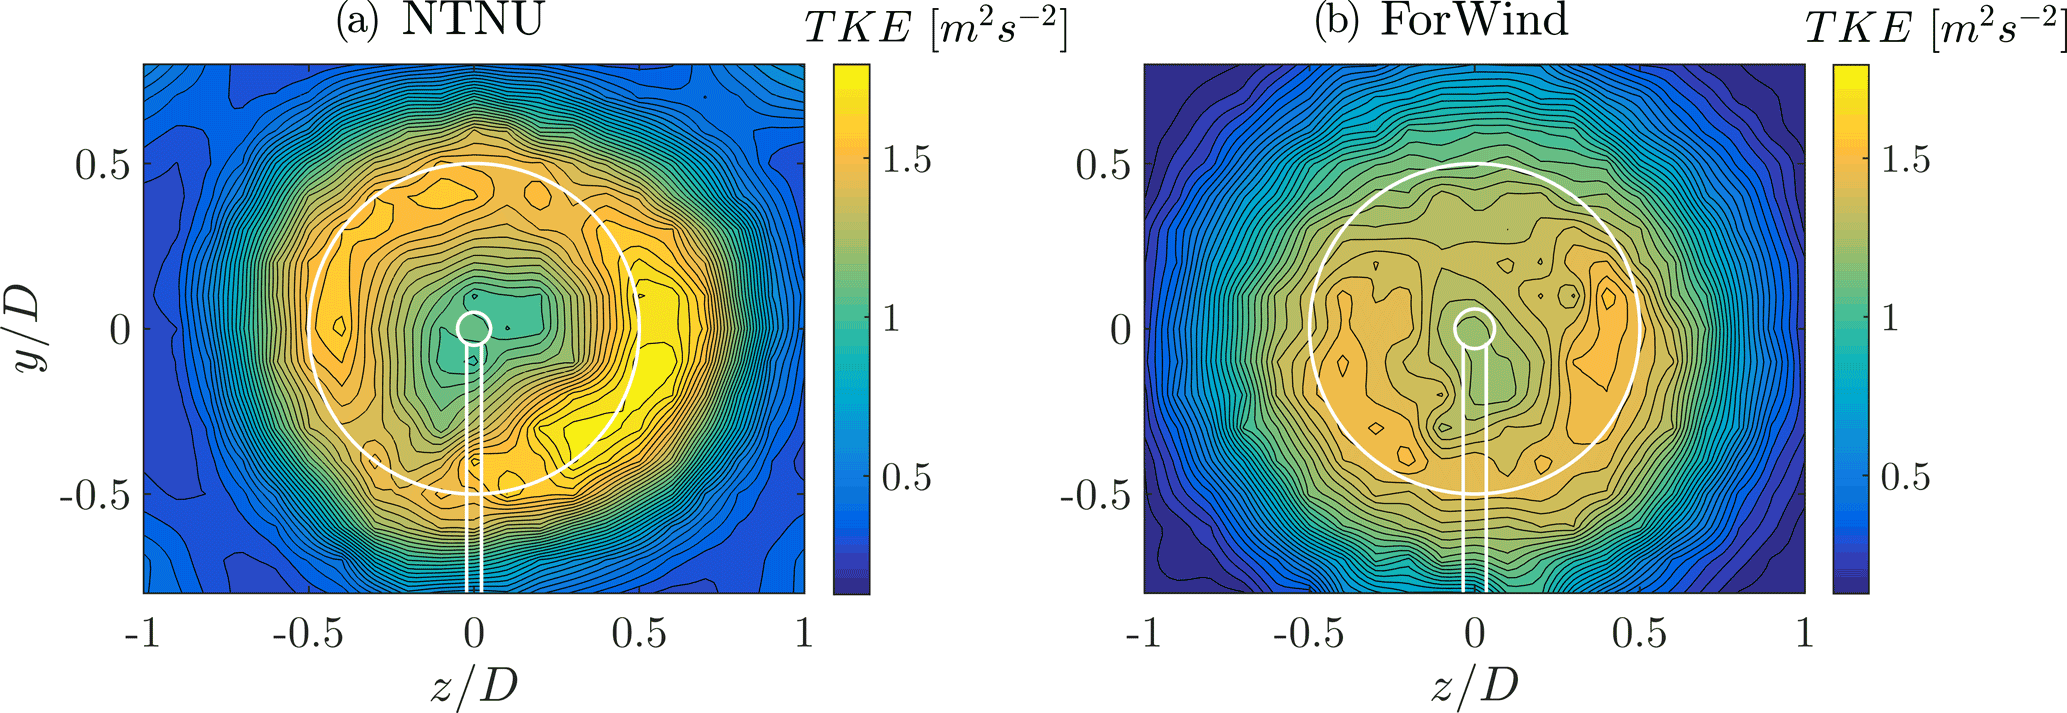
Figure 6Turbulent kinetic energy (TKE) in m2 s−2 according to Eq. (4) for γ=0∘. (a) NTNU turbine, (b) ForWind turbine.
The contours of the TKE appear as circular shape, slightly larger than the rotor area. Behind the NTNU rotor, an outer ring of high TKE values appears more pronounced than in the center region. This observation is significantly less distinct for the ForWind turbine. The differences of the pronounced ring arise most likely from the different blade geometries. The airfoil of the NTNU turbine (NREL S826) has higher lift coefficients for the relevant angles of attack and Reynolds numbers than the ForWind rotor (SD7003 airfoil). A comparison of both airfoils is given by Schottler et al. (2017b). As a result, larger pressure differences between suction and pressure side of the blades are expected, resulting in more pronounced tip vortices shed from the NTNU rotor. Although those are already decayed at (Eriksen and Krogstad, 2017), the tip vortices are likely to be the origin for a pronounced TKE at blade tip locations behind the NTNU rotor. Further increasing in complexity and completeness of the wakes' stochastic description, Fig. 7 shows the contour plots of the shape parameter λ2 behind both turbines.
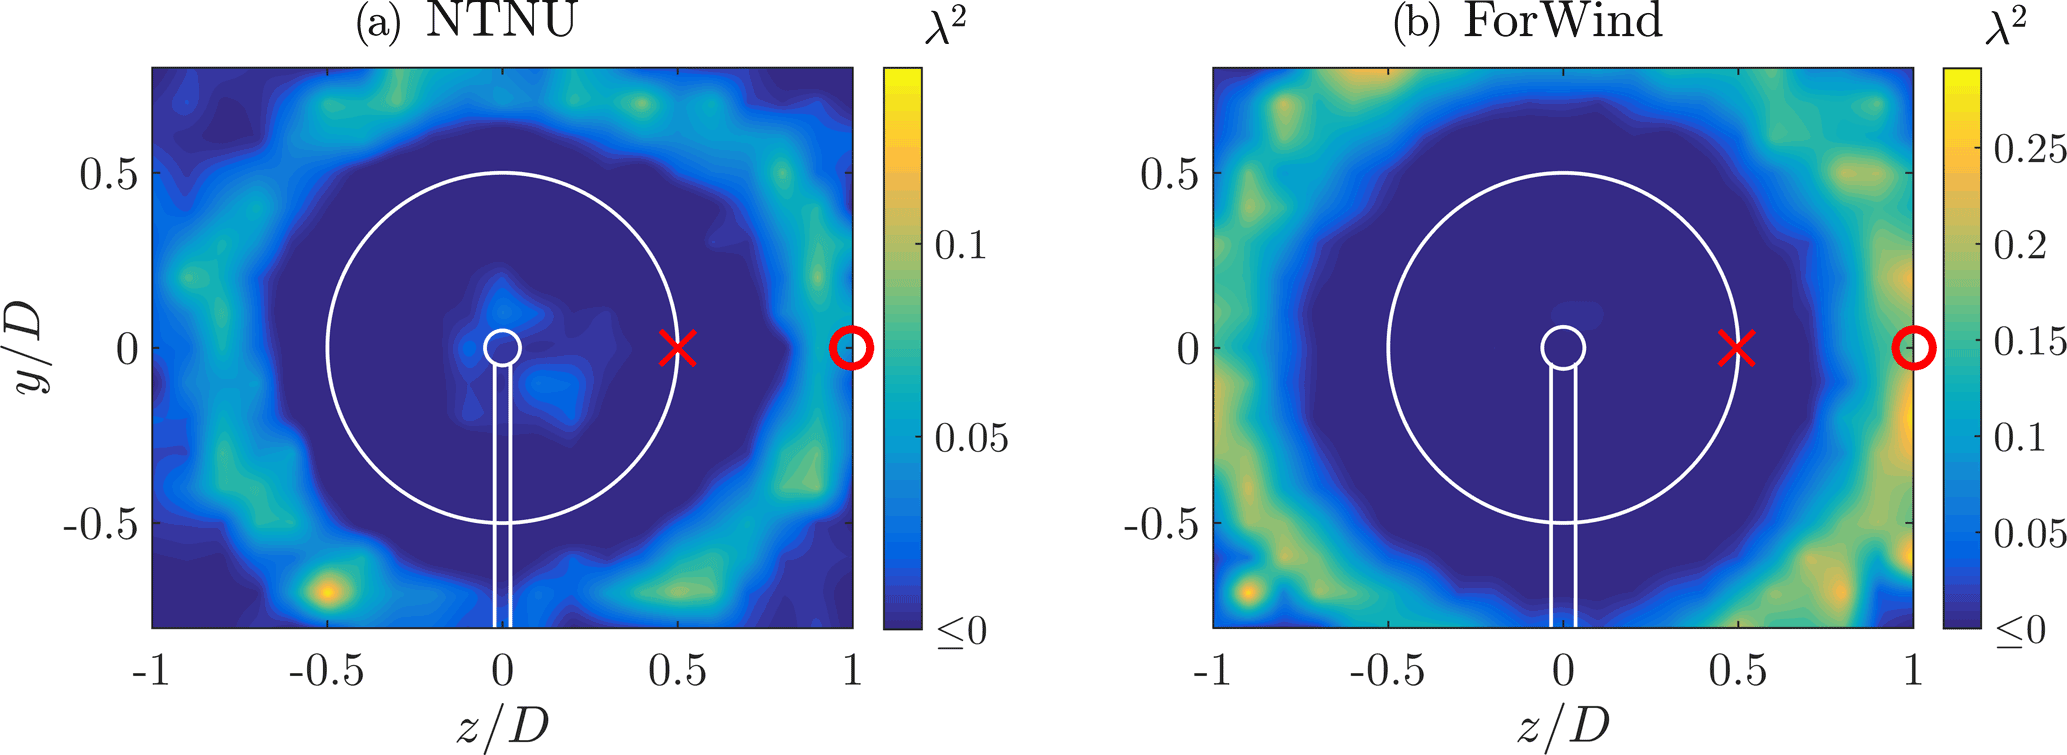
The length scale τ is related to the rotor diameter D of the respective turbine. The scale is transferred from space to time using Taylor's hypothesis; cf. Eq. (8). In both cases, the contours of λ2 show a circular ring, whose diameter is significantly larger than the rotor diameter.
In order to quantify the qualitative shapes of the contours shown in Fig. 7, Fig. 8 shows the increment PDFs of the respective time series, p(uτ), at the positions indicated by the red marks () in Fig. 7. uτ is normalized by the standard deviation, στ, for better visual comparison.
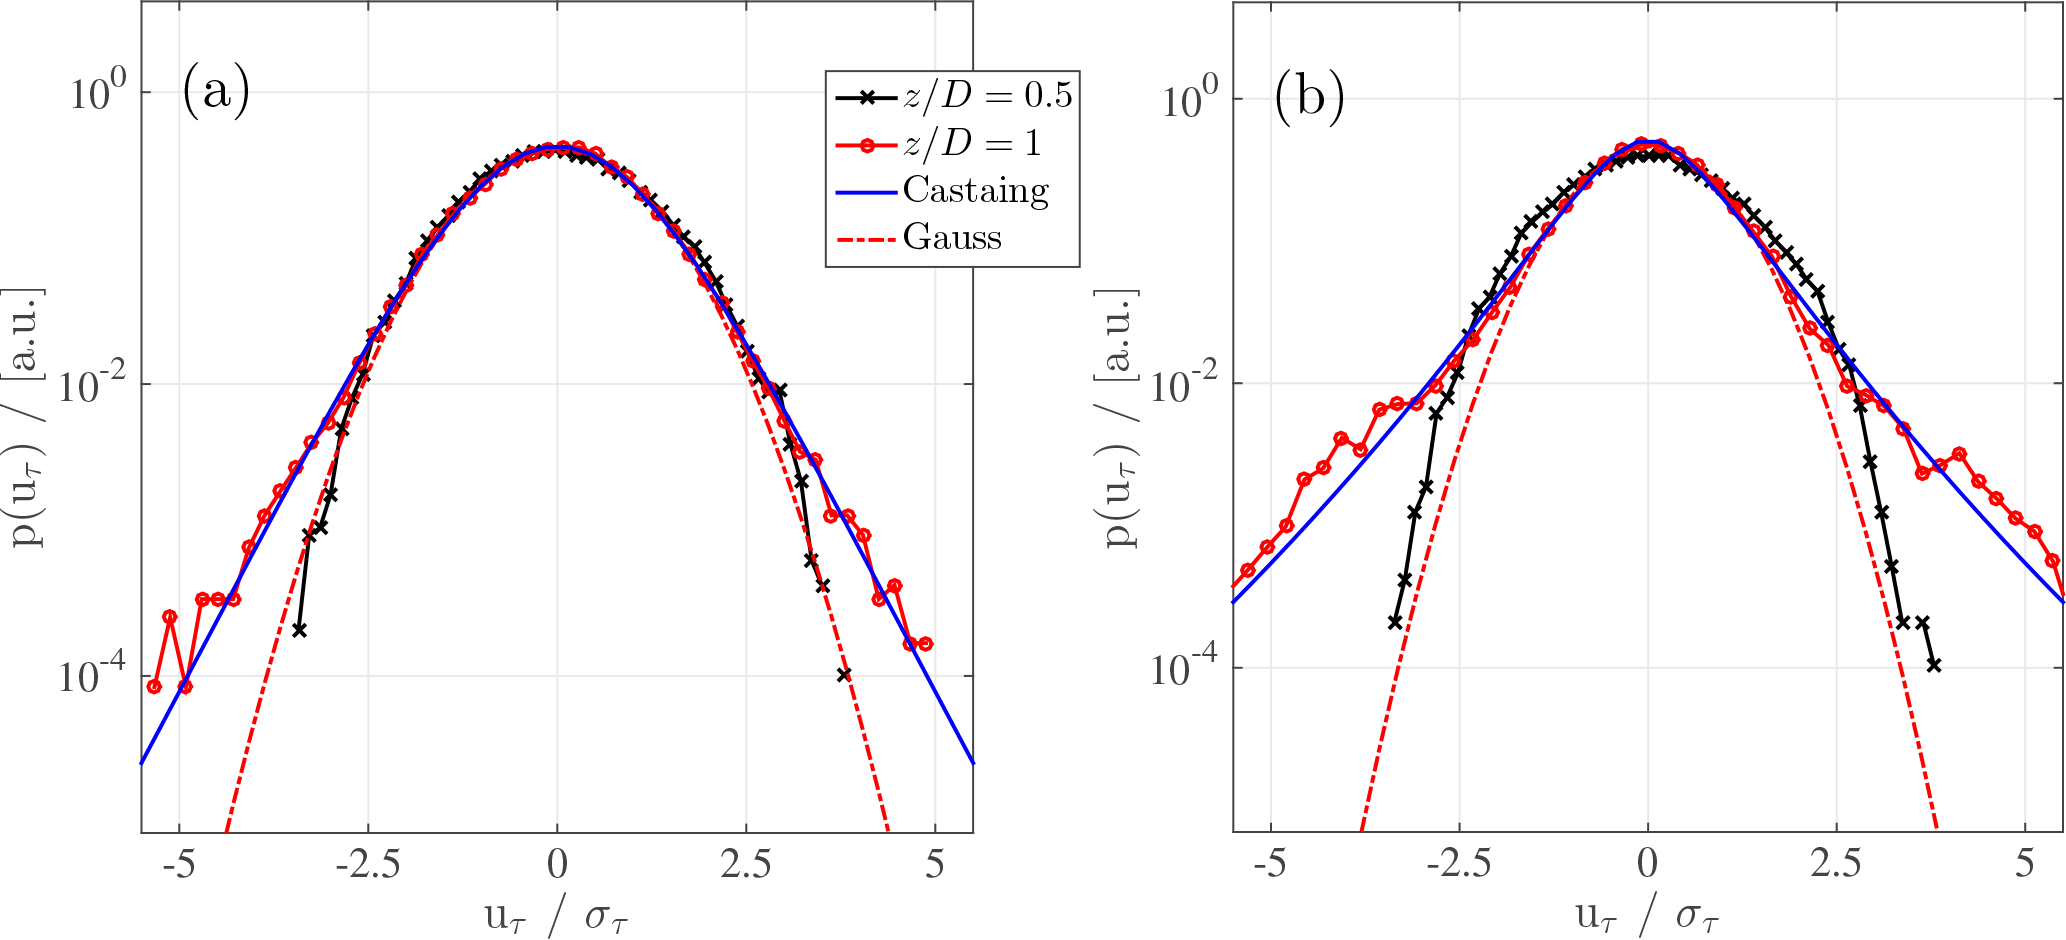
Figure 8p(uτ) of the time series at two measurement positions (; ), corresponding to the red marks in Fig. 7. (a) NTNU turbine, (b) ForWind turbine, both at γ=0∘. The timescales τ are related to the length scales of rotor diameters by Taylor's hypothesis using Eq. (8). For (red curve) the Castaing distribution is shown with and (Castaing et al., 1990). A Gaussian fit is added to guide the eye.
As shown in black, the positions behind the rotor tips, where λ2≈0, reveal increment PDFs very close to a Gaussian distribution, which holds for both turbines. For z=D, which lies within the ring of large λ2 values, p(uτ) strongly deviates from a Gaussian, showing a heavy-tailed distribution. Figure 8 further shows p(uτ) based on the model proposed by Castaing et al. (1990). Those distributions were evaluated based on the λ2 values computed by Eq. (6) at z=D, visualizing exemplarily how well the distributions' shapes are grasped by λ2. Our results show that, depending on the examined quantity, different radial wake regions are of interest. To compare the varying spatial extensions of the three quantities' significant areas, Fig. 9 shows diagonal cuts through the respective contour plots for the non-yawed cases along the line y=z.
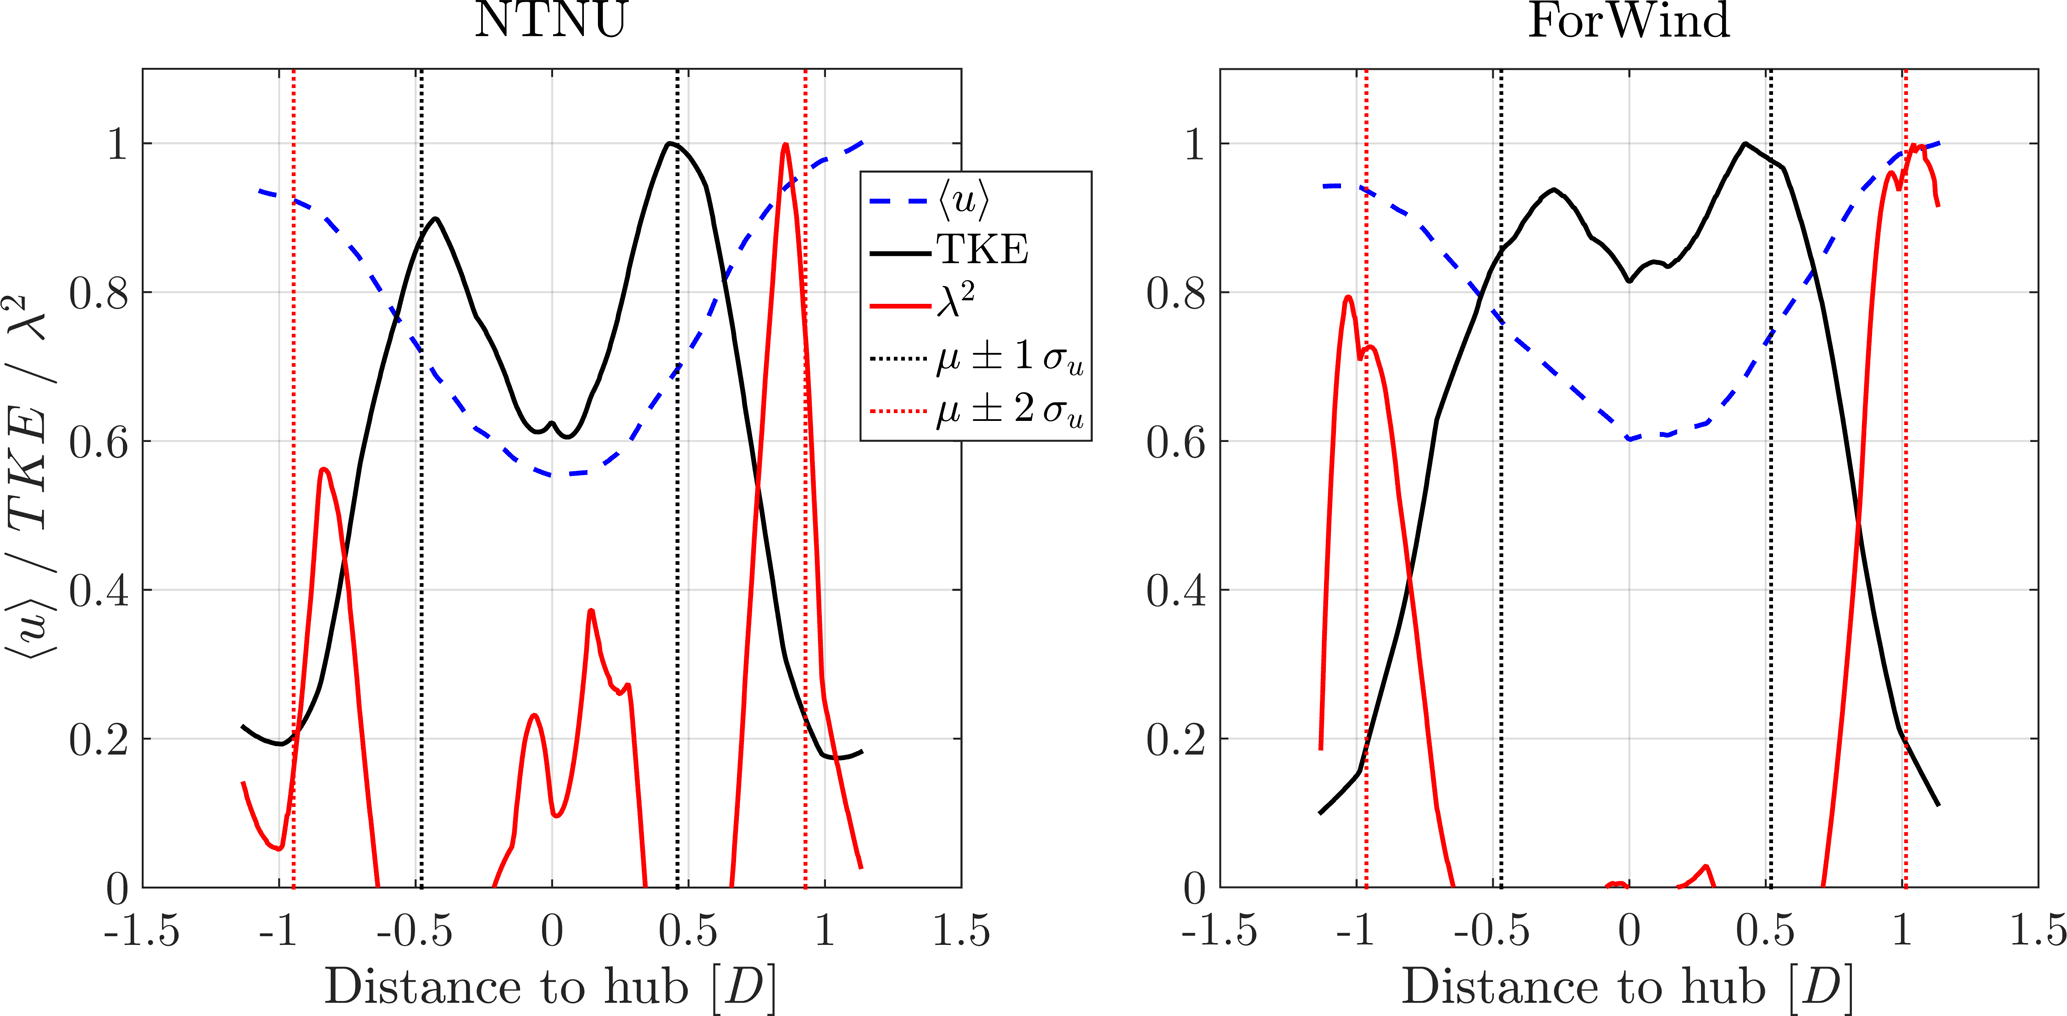
Figure 9Diagonal cuts on the line y=z through the contour plots for γ=0∘. Values are normalized to their respective maximum. The vertical dotted lines mark μ±1σu (black) and μ±2σu (red) of a Gaussian fit through the velocity deficit shown in blue.
The area of pronounced TKE approximately coincides with the rotor area. The notable peaks are separated by ≈0.86 D (NTNU) and ≈0.77 D (ForWind) and are significantly less pronounced behind the ForWind rotor as previously described. Clearly, the λ2 peaks span a much larger distance: approximately 1.7 D (NTNU) and 2.0 D (ForWind). At their location, the velocity deficit has recovered to ≥90 % of the free-stream velocity in all cases. Thus, for a thorough description of wind turbine wakes, a much larger radial area is of interest as compared to a description restricted to mean values and the turbulent kinetic energy as often done in literature and wake models. An approximation of the lateral extension of high TKE and λ2 values based on a Gaussian fit through the velocity deficit is given by μ±1σu and μ±2σu, respectively, with μ being the mean value and σu the standard deviation of the fit. For illustration, the dotted lines in Fig. 9 mark the respective locations. It is shown that the radial areas of TKE and λ2 can be related in this way to the velocity deficit. To get a feeling of the impact on potential downstream turbines, Fig. 10 compares p(uτ) in absolute terms at a free-stream position (, ) and at a position featuring high λ2 values (, ), exemplary for the ForWind turbine. It becomes clear that velocity increments exceeding 3 m s−1 occur much more frequently within the ring of high λ2 values than in the free stream. Hereby we show that this radial position of the wake features significantly different flows than the free stream. To compare more visually, Fig. 11 shows the corresponding time series uτ(t). Clearly, the spiky signature of extreme events becomes obvious in Fig. 11b, confirming that no free-stream condition is reached at .
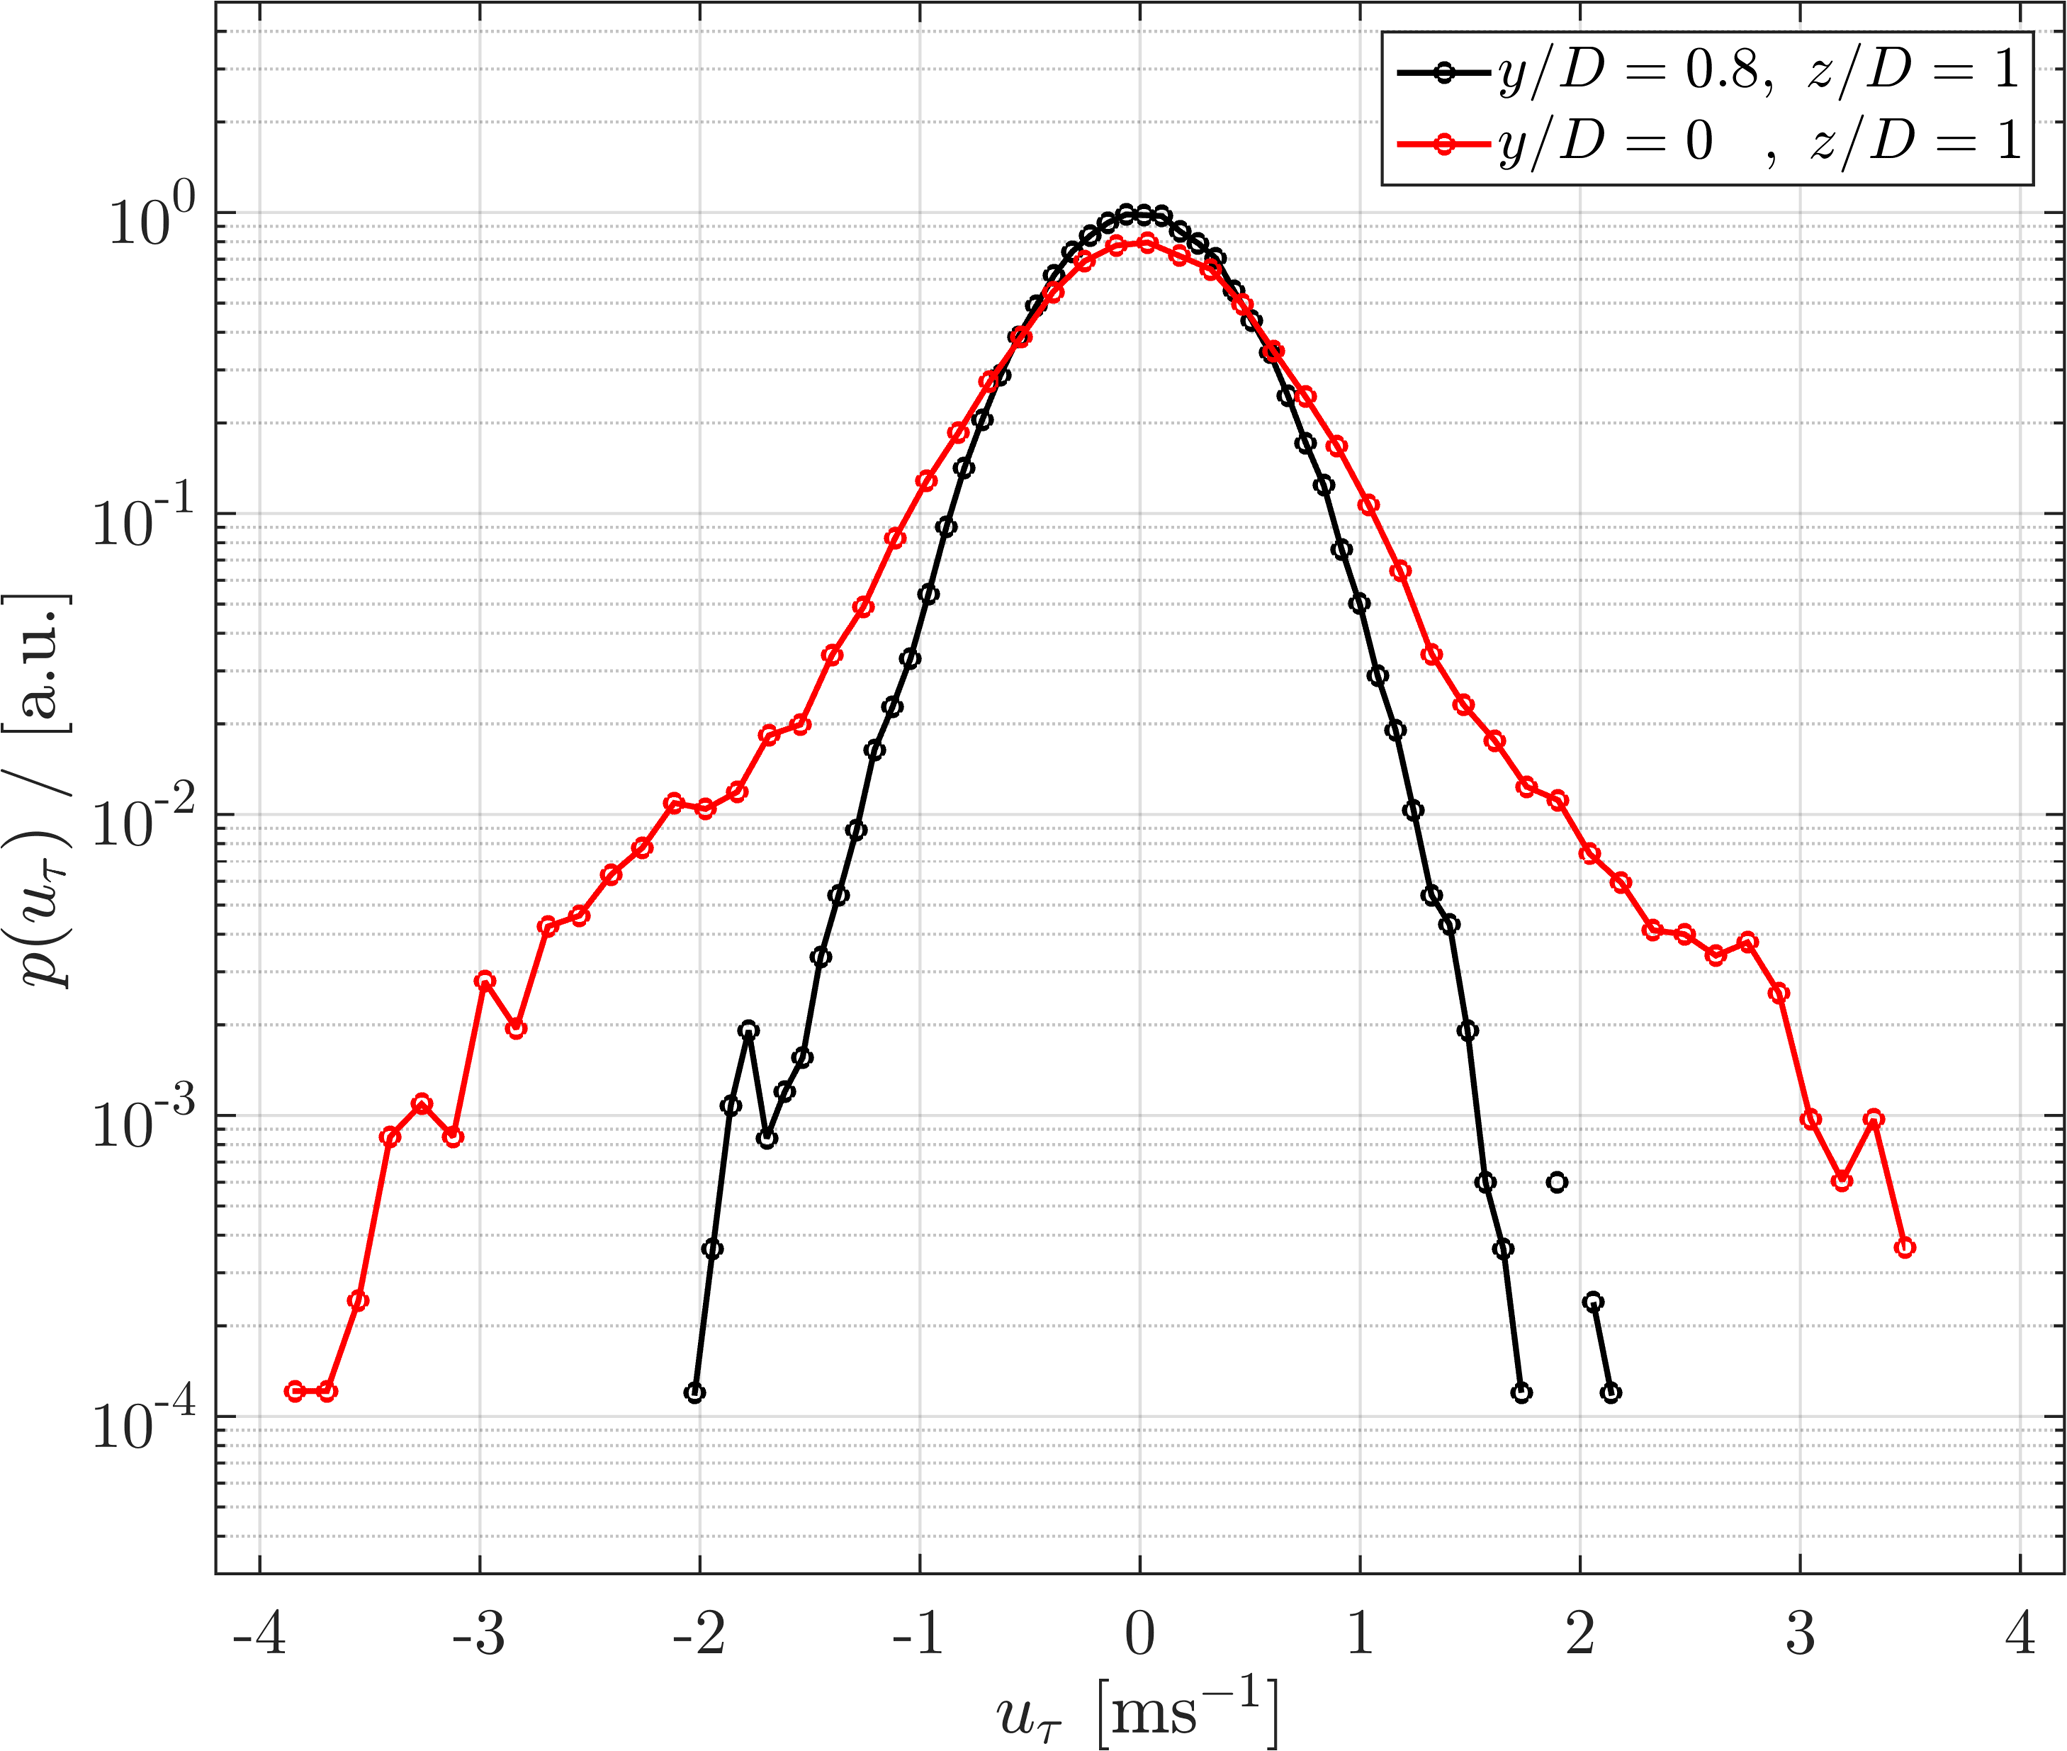
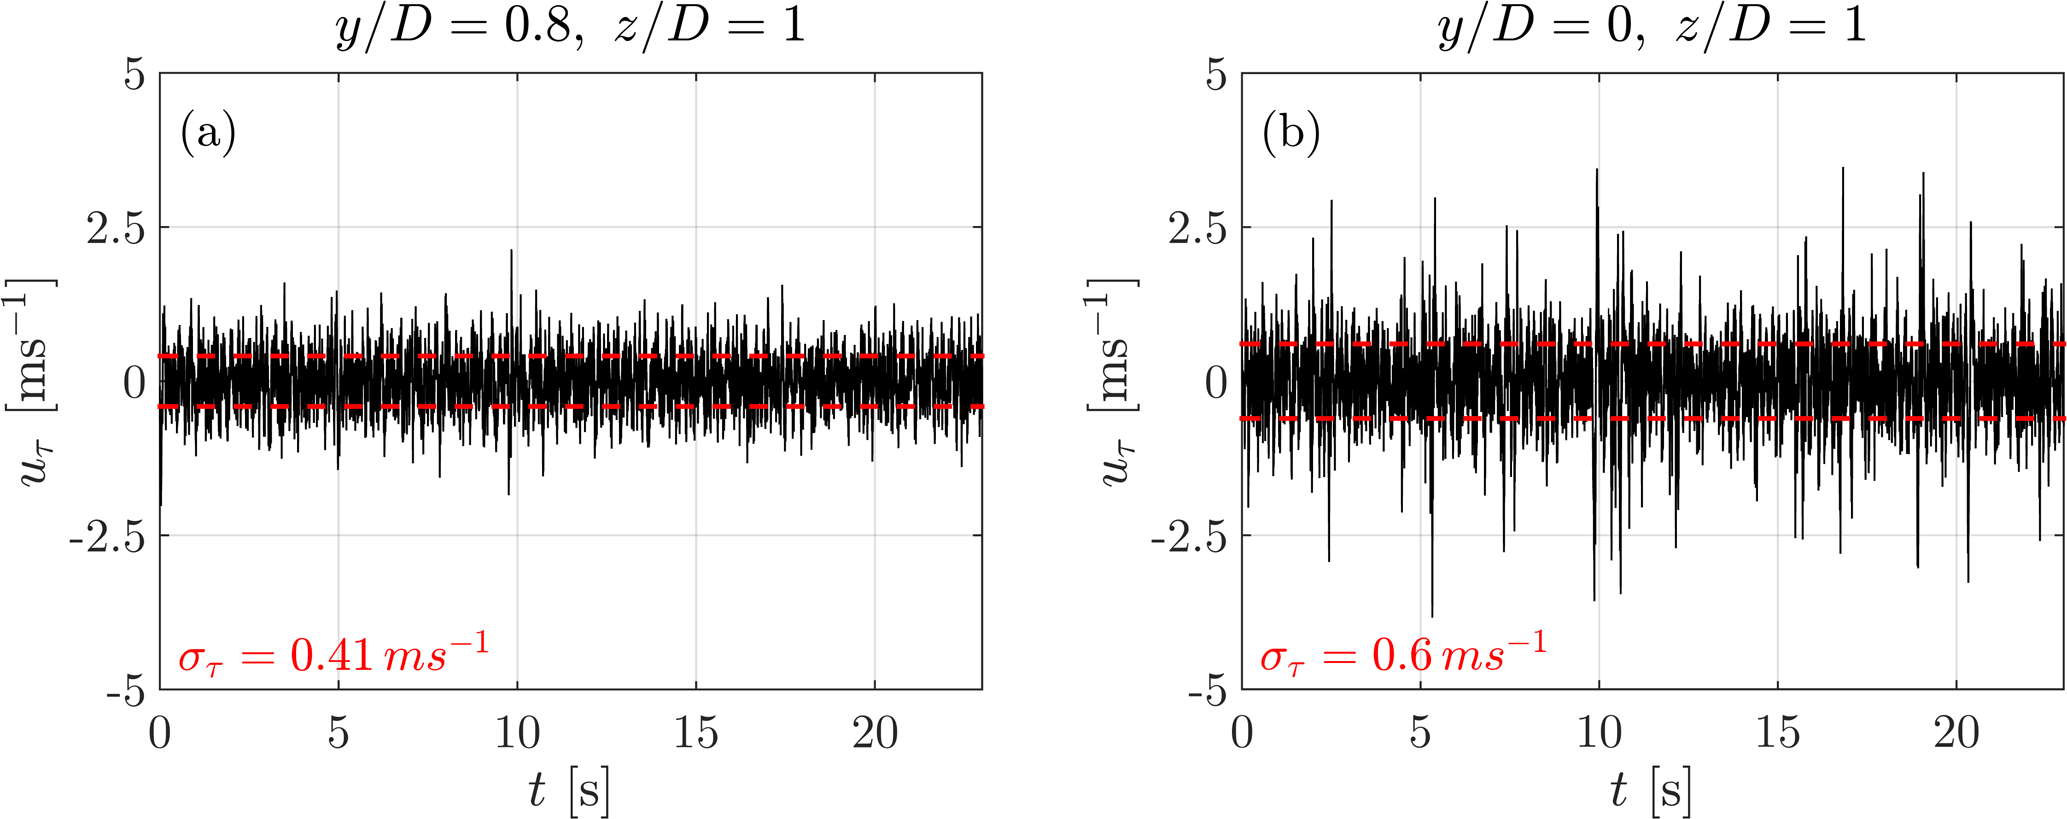
Figure 11Time series of increments uτ(t) for the positions , (free stream, a) and , (a). The standard deviations στ are indicated in red.
3.2 Wakes during yaw misalignment
During a yaw misalignment of ∘, the velocity deficits behind both rotors are deflected and deformed as shown in Fig. 12 by the contours of the main flow component 〈u〉∕uref.
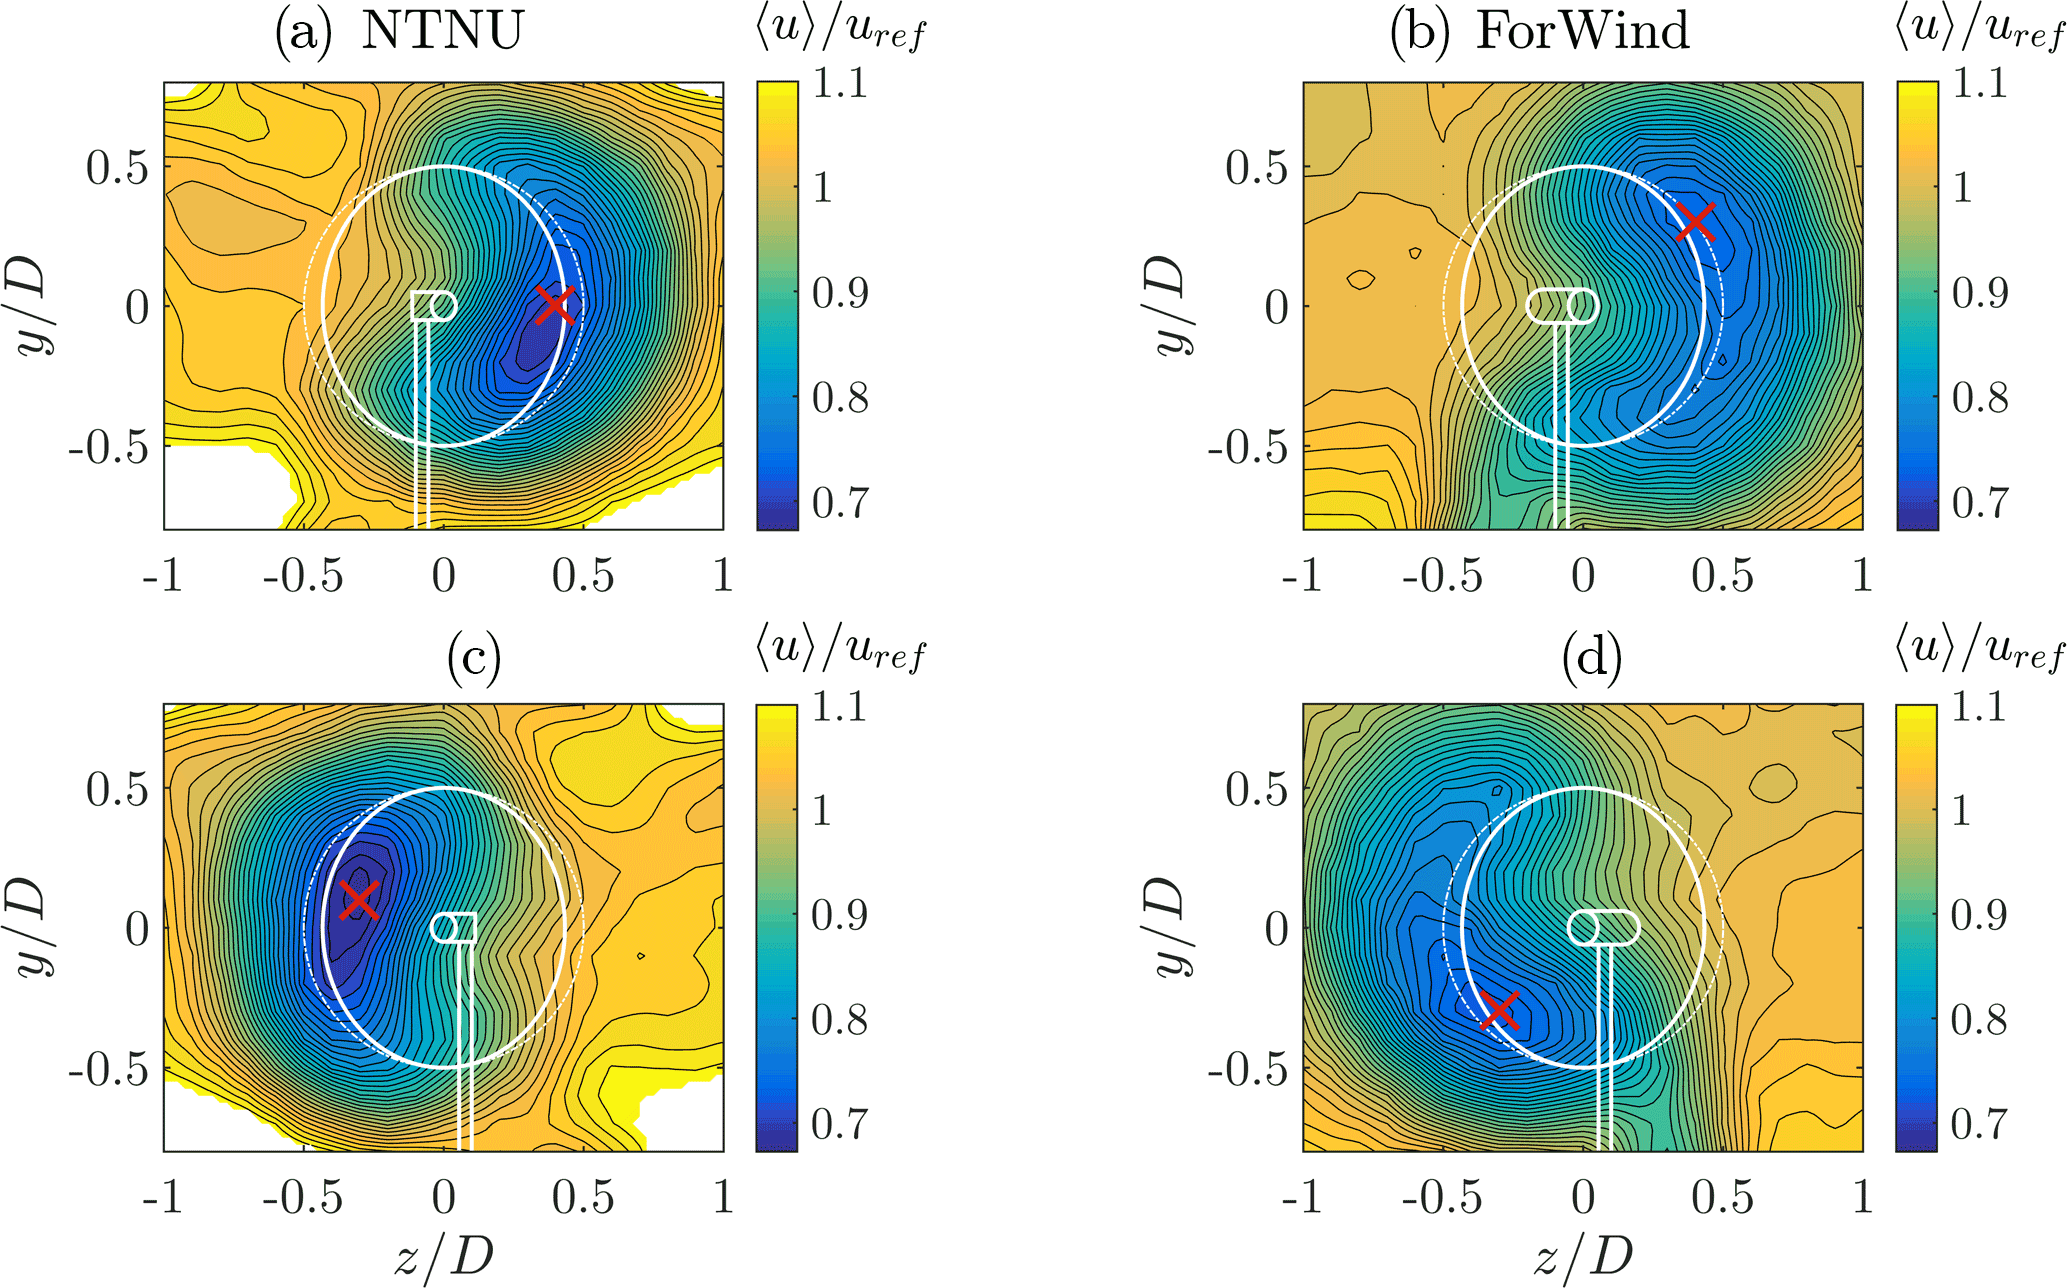
Figure 12〈u〉∕uref during yaw misalignment. (a, b) ∘, (c, d) γ=30∘. (a, c) NTNU turbine, (b, d) ForWind turbine. The solid white lines indicate the contours of the respective turbine, while the dashed lines denote the rotor area without yaw misalignment. The red × marks the position of minimum measured velocity 〈u〉. Values exceeding 1.1 are masked for better comparison.
The wakes are deflected sideways behind both turbines, whereas the lateral direction is dependent on the yaw angle's sign. This is expected due to a lateral thrust component of the rotor as a result of yaw misalignment, which has been observed and described in numerous studies, including Medici and Alfredsson (2006), Jiménez et al. (2010), Vollmer et al. (2016) and Trujillo et al. (2016). The deflection of the velocity deficit is quantified using the approach described in Sect. 2.2; the results are listed in Table 2, including the resulting wake skew angles.
Table 2Wake center location as computed by the approach described in Sect. 2.2 with corresponding skew angles.
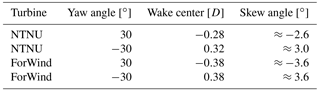
As Table 2 shows, the skew angles behind the ForWind turbine are equal apart from their sign for both directions of yaw misalignment. The NTNU rotor, however, shows slightly different deflection angles for γ=30∘ and ∘, which is likely caused by blockage effects, which play a more significant role for the NTNU rotor due to the larger blockage ratio. This can also be seen in Fig. 12, where speed-up effects are visible in the corners. In Schottler et al. (2017b), where the same setup was used1, the skew angle for the NTNU rotor decreased from to , which is a further indication for wall effects due to blockage, especially during yaw misalignment. Furthermore, both values show smaller angles as for the ForWind turbine.
In Fig. 12, minimum 〈u〉 values are marked, showing a vertical transport of momentum in all cases. For γ=30∘, the wake is moved upwards behind the NTNU turbines and downwards behind the ForWind rotor. Directions are reversed for ∘. Similar observations have been made by Bastankhah and Porté-Agel (2016). The vertical transport is related to an interaction of a wake's rotation with the tower shadow/ground. Our results isolate this effect, as the direction of vertical transport is opposite comparing both turbines, having an opposite direction of rotation. The fact that the vertical transport is stronger behind the ForWind rotor further supports this explanation as the tower wake is more pronounced due to the larger tower diameter and the structure the turbine is placed on. A deformation of the velocity deficit to a curled “kidney” shape is observed for both turbines during yaw misalignment, whereas it is slightly more pronounced behind the ForWind turbine. The curled shape behind a wind turbine model in yaw has previously been observed by Howland et al. (2016) using a drag disc of 30 mm diameter and by Bastankhah and Porté-Agel (2016) using a rotating turbine model of 150 mm diameter. Figure 12 confirms these findings on two further scales. For a better comparison of the curled shape of the velocity deficit during yaw misalignment, we apply the following parametrization, exemplarily shown in Fig. 13a for the ForWind turbine at γ=30∘: data points of horizontal cuts through the wake, , are fitted by a polynomial. The procedure is repeated for values of y ranging from −0.4 D to 0.4 D. The positions of the polynomials' minima (green marks) are fitted by a quadratic function (red line). Figure 13b shows the comparison of both turbines for ∘.
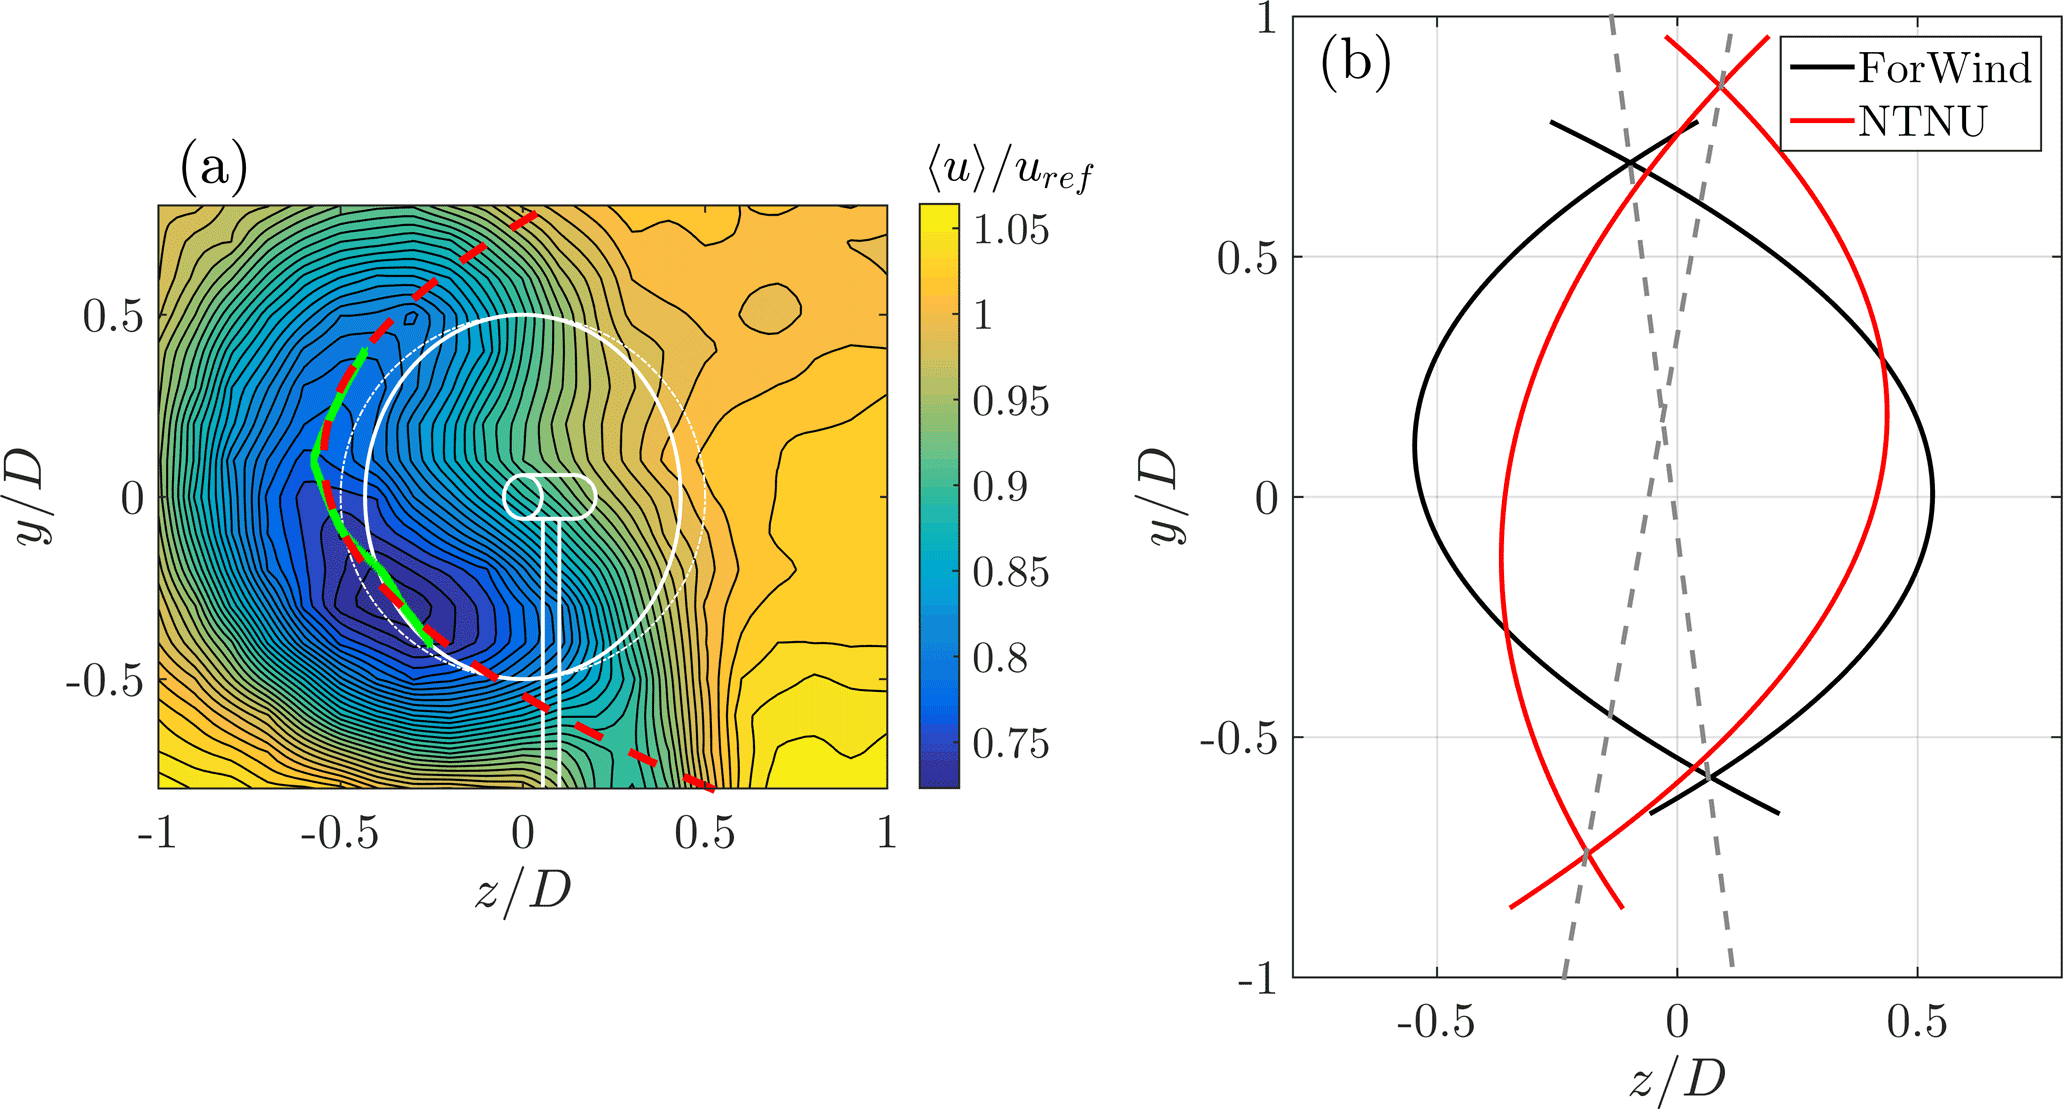
Figure 13(a) Example of parameterizing the curled shape of the velocity deficit. The green markings show minimal velocities of a polynomial function used to fit the interpolated data points in a horizontal line; y is a constant. The red dashed line shows a quadratic fit based on the green markings. (b) Visualization of the curled shapes of the velocity deficits. For both turbines, the cases ∘ are shown. Dashed lines show a visualization of the wakes tilt, connecting the respective intersections of the curves.
As already seen in Fig. 12, the wakes behind the ForWind turbine are deflected further and the curled shape is more strongly pronounced, which can be attributed to blockage effects. Figure 13b also shows that the wakes behind both turbines are slightly tilted. Looking at the black curves (ForWind turbine), an asymmetry can be noticed as the curves are tilted towards the left, while the red curves are tilted towards the right. This is illustrated by the gray dashed lines in Fig. 13b which connect the points of intersection for ∘. Not shown in detail here, the same effect was observed for different inflow conditions and other downstream distances, using the same setup and methods as in this study. Similar asymmetries have been observed by Bastankhah and Porté-Agel (2016) for positive and negative yaw angles, which is explained by an interaction of a wake's rotation with the tower wake and the ground. By using turbines of opposite rotation direction, we can attribute the asymmetries in vertical transport and tilt in opposite direction for ∘ to the rotation of rotor and wake.
Adding TKE and λ2 contours during yaw misalignment, Fig. 14 shows all three examined quantities, exemplary at a yaw misalignment of ∘, for both turbines. The shapes of the TKE contours are deformed similarly to 〈u〉. A curled shape evolves, and the differences between both turbines as described for are still notable during yaw misalignment.
Similarly, the circular rings of high λ2 values are deformed to a curled shape at ∘. Thus, the general effect of heavy-tailed increment PDFs surrounding the velocity deficit in a wake is stable against yaw misalignment and the resulting inflow variations at the rotor blades. Further, this finding is confirmed in large-eddy simulations (LES) performed at the Universidad de la República, Uruguay, shown in Appendix B.
It is found to be a general effect as it is observed for all wakes considered, independent of yaw misalignment or turbine design.
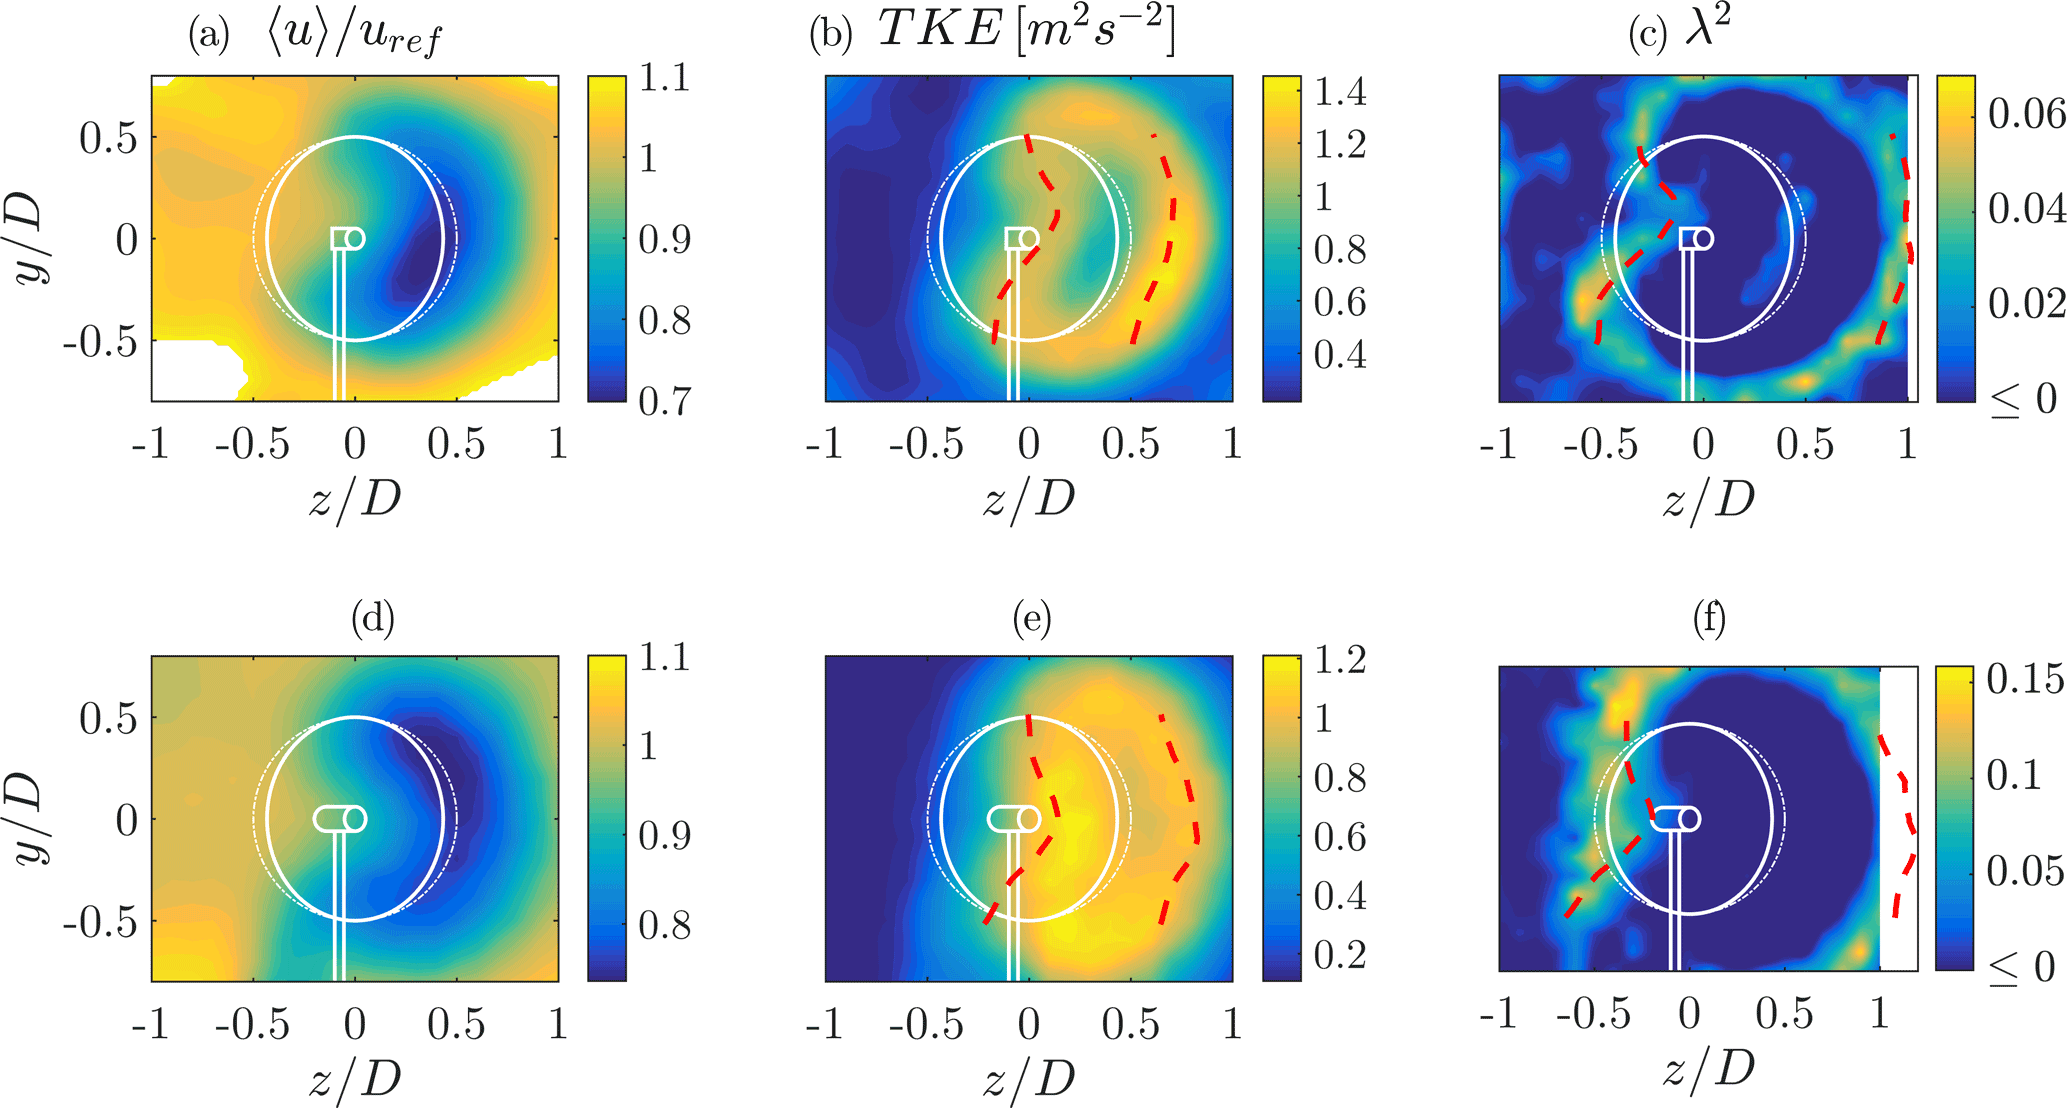
Figure 14〈u〉∕uref (a, d), TKE (b, e) and λ2 (c, f) for ∘ behind the NTNU turbine (a–c) and the ForWind turbine (d–f). The timescale for λ2 corresponds to the length scale of the rotor diameter. The red marks show the approximation of the respective parameter's radial extension based on μ±1σu (TKE, b, e) and μ±2σu (λ2, a, d) as described in Sect. 3.1.
The red markings in Fig. 14 show the approximation of the radial extension of the TKE and λ2 based on μ±1σu and μ±2σu. μ and σu correspond to Gaussian fits of the velocity deficits at various horizontal cuts (y is a constant) from to , with μ being the fit's mean value and σu the standard deviation. It is shown that the method results in quite good first-order approximations, even during yaw misalignment.
In this study the characterization of yawed and non-yawed wind turbine wakes is investigated and extended by taking into account a further turbulence measure, namely the intermittency parameter λ2. We find heavy-tailed distributions of velocity increments in a ring area surrounding the velocity deficit and areas of high TKE in a wind turbine wake. Thus, the definition of a wake width strongly depends on the quantities taken into account as the ring area features significantly different statistics than the free stream. The heavy-tailed distributions are the statistical description of large velocity changes over given timescales and are transferred to turbines in terms of loads and power output. This has been shown experimentally (Schottler et al., 2017c), numerically (Mücke et al., 2011) and in a field study by Milan et al. (2013). Consequently, our findings should be considered in wind farm layout optimization approaches, where a wake's width is a crucial parameter for radial turbine spacing. As layouts are being optimized regarding power and loads, the latter might be significantly affected by taking into account intermittency and the resulting increased wake width. Possibly, the ring of non-Gaussian velocity increments is a result of instable flow states, where the flow switches between a wake and free stream state. Behind a rotor, the wake characteristics dominate the flow. Outside the wake, free-stream properties are dominant. In the transition zone, a switching between both flow states is believed to result in heavy-tailed velocity increments and therefore high λ2 values. Generally, λ2 will be larger for smaller scales τ, which is a known feature of turbulence (Frisch, 1995). Care should be taken when interpreting λ2 as an indicator for an increment PDF's shape. Here, we use the shape parameter as a qualitative indicator. For a more quantitative analysis, one has to consider the increment PDF of a time series directly. This is done in Fig. 8 exemplarily for chosen points; however, in order include all time series of a wake, using λ2 allows for a much better visualization and comparison.
Figure 14 shows that the velocity deficit is deflected laterally during yaw misalignment, so that a potential in-line downstream turbine would exhibit a power increase as more undisturbed flow hits the rotor area at . Looking at the λ2 contours, however, shows that areas of non-Gaussian velocity increments are now deflected onto the rotor area. This becomes important when assessing the applicability of active wake steering approaches, as a gain in power has to be balanced with a potential load increase, affecting maintenance costs and the lifetime of turbines overall. It should be noted that it is to date not clear to what extent high TKE levels and intermittent force data are affecting common ways of fatigue and extreme-load calculations. This important aspect needs to be addressed in future works. It might depend quite strongly on details such as considered timescales. In our opinion, it is likely that non-Gaussian inflow is linked to drive train, gear box or pitch system failures, especially because those inflow characteristics are not accounted for in standard models used in the design process of wind turbines.
The velocity deficit in mean flow direction 〈u〉 deforms to a curled kidney shape during yaw misalignment. Consequently, horizontal cuts through the wake are insufficient when characterizing wakes behind yawed rotors, resulting in misleading and incomplete conclusions when quantifying wake deflections by yaw misalignment. The parametrization of the wake's curl shown in Fig. 13 should not be interpreted as a quantification. Instead, we use the described approach to better compare multiple curled wakes as done in Fig. 13b. Our analyses include the velocity deficit in mean flow direction, the turbulent kinetic energy and the shape parameter λ2. The turbulence intensity in the wakes revealed very comparable results to the TKE, which is why we restrict our analyses to the TKE. For the majority of wakes considered, only two flow components were recorded. For one exemplary wake, however, all three components are available, allowing the assumption of to be examined; cf. Eq. (4). Figure 15 shows the contours of k and k* as well as 〈v′(t)2〉 versus 〈w′(t)2〉 for all measurement positions. Both contour plots show neglectable differences, confirming the approximation. This is further supported by a high correlation coefficient of 0.94 between 〈v′(t)2〉 and 〈w′(t)2〉.
Besides the lateral deflection, a vertical transport of the velocity deficit is observed for both turbines during yaw misalignment. Using counter-rotating turbines, this effect could be attributed to the wake's rotation and its interaction with the tower wake. In full-scale scenarios, the ground, wind shear and rotor tilt would further contribute to the effect. For potential floating turbines, a pitch motion will deflect the wake upwards; see Rockel et al. (2014). This vertical deflection will interact with the vertical transport shown in Fig. 12. Consequently, the direction of yaw misalignment is believed to be of importance when applying the concept of wake steering to wind farm controls. This confirms findings by Fleming et al. (2014a) and Schottler et al. (2017a), reporting an asymmetric power output of a two-turbine case with respect to the upstream turbine's angle of yaw misalignment. One should bear in mind that the inflow turbulence intensities are different regarding both turbines. We want to point out that the influence of inflow turbulence on the wake deflection is investigated by Bartl et al. (2018), showing no significant effects.
This work shows an experimental investigation of wind turbine wakes, using two different model wind turbines. The analyses include the main flow component, the turbulent kinetic energy and two-point statistics of velocity increments, quantified by the shape parameter λ2. Yaw angles of are considered at a downstream distance of . Generally, the results of 〈u〉, the TKE and λ2 compare well for both model turbines. Minor differences could be ascribed to the more prominent blockage (12.8 vs. 5.4 %) in the NTNU setup, confirming findings by Chen and Liou (2011) even for wake velocity measurements, who state blockage effects can be neglected for a blockage ratio ≤10 %. An outer ring of heavy-tailed velocity increments surrounds the velocity deficit and areas of high TKE in a wind turbine wake. The wake features significantly non-Gaussian velocity increment distributions in areas where the velocity deficit recovered nearly completely. For γ=0∘, the ring has a diameter of approximately 1.7D–2D, depending on the turbine. Based on a Gaussian fit through the velocity deficit, the radial location of intermittent increments can be approximated by μ±2σu (μ being the mean value, σu the standard deviation of the fit), making a wake considerably wider when taking two-point statistics into account. This observation becomes important in wind farm layout optimization and active wake steering approaches through yaw misalignment. During yaw misalignment, the circular shape of a wake is deformed to a curled kidney shape. A method for parameterizing the curl shape was introduced. The lateral wake deflection was quantified, resulting in skew angles of ±3.6∘ at ±30∘ for the smaller rotor and 3.0 and −2.6∘ for the larger rotor. Furthermore, vertical momentum transport in the wake during yaw misalignment was observed. The direction of vertical transport is dependent on the direction of yaw misalignment. Using counter-rotating turbines, the effect could be attributed to an interaction of a wake's rotation with the tower wake in this study.
The experimental data sets along with further documentation are available at https://doi.org/10.5281/zenodo.1193656 (Schottler et al., 2018). We encourage researchers to use the data for validation purposes or any other scientific use.
In order to study intermittency using the shape parameter λ2, uniformly sampled data are needed when applying Eq. (5). As the LDA measurement result in non-uniformly sampled data points, appropriate preprocessing is necessary. In the following, the procedure is described that results in uniformly sampled data points. It is exemplarily applied to the data of an arbitrarily chosen wake. The time separating two samples of a time series is Δt. For one time series, (Δt)−1 is plotted for all samples in Fig. A1a. The corresponding histogram is shown in Fig. A1b. The point corresponding to 40 % of all events is marked by the red dashed line and is referred to as FS. In this example, FS≈1.17 kHz.
This procedure is repeated for all 357 time series contained in one plane of measurement. Figure A2 shows FS for all time series, with the mean value indicated.
The mean value of all FS values in one plane will be used as the sampling frequency to resample the time series in one plane uniformly; an exemplary result is shown in Fig. A3.
Data points are interpolated linearly onto a vector of uniformly spaced instants defined by the new sampling rate 〈FS〉. It should be noted that the analyses of velocity increments were performed for different constant sampling rates without showing any significant effect on the results.
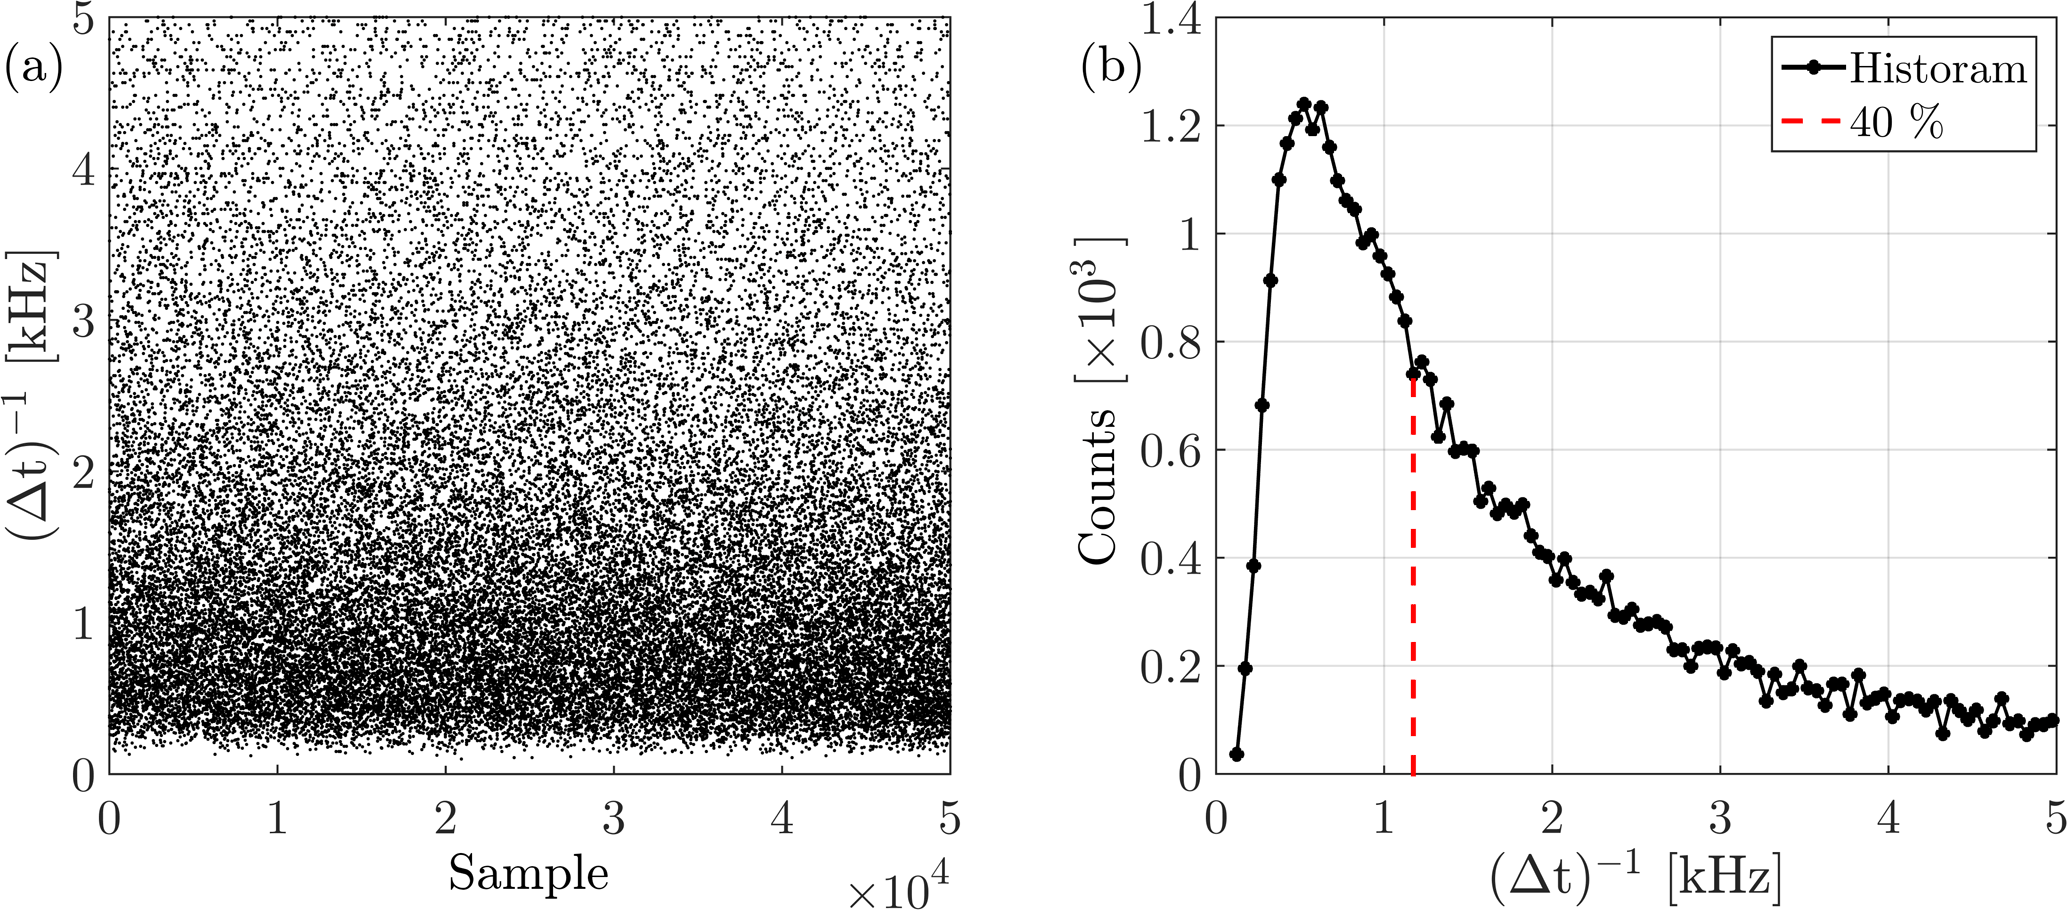
Figure A1(Δt)−1 for all samples (a) with the respective histogram (b), where the maximum value is marked by the red dashed line.

Figure A2FS for all 357 time series of one wake; the mean value is indicated in red: 〈FS〉=1.4 kHz.
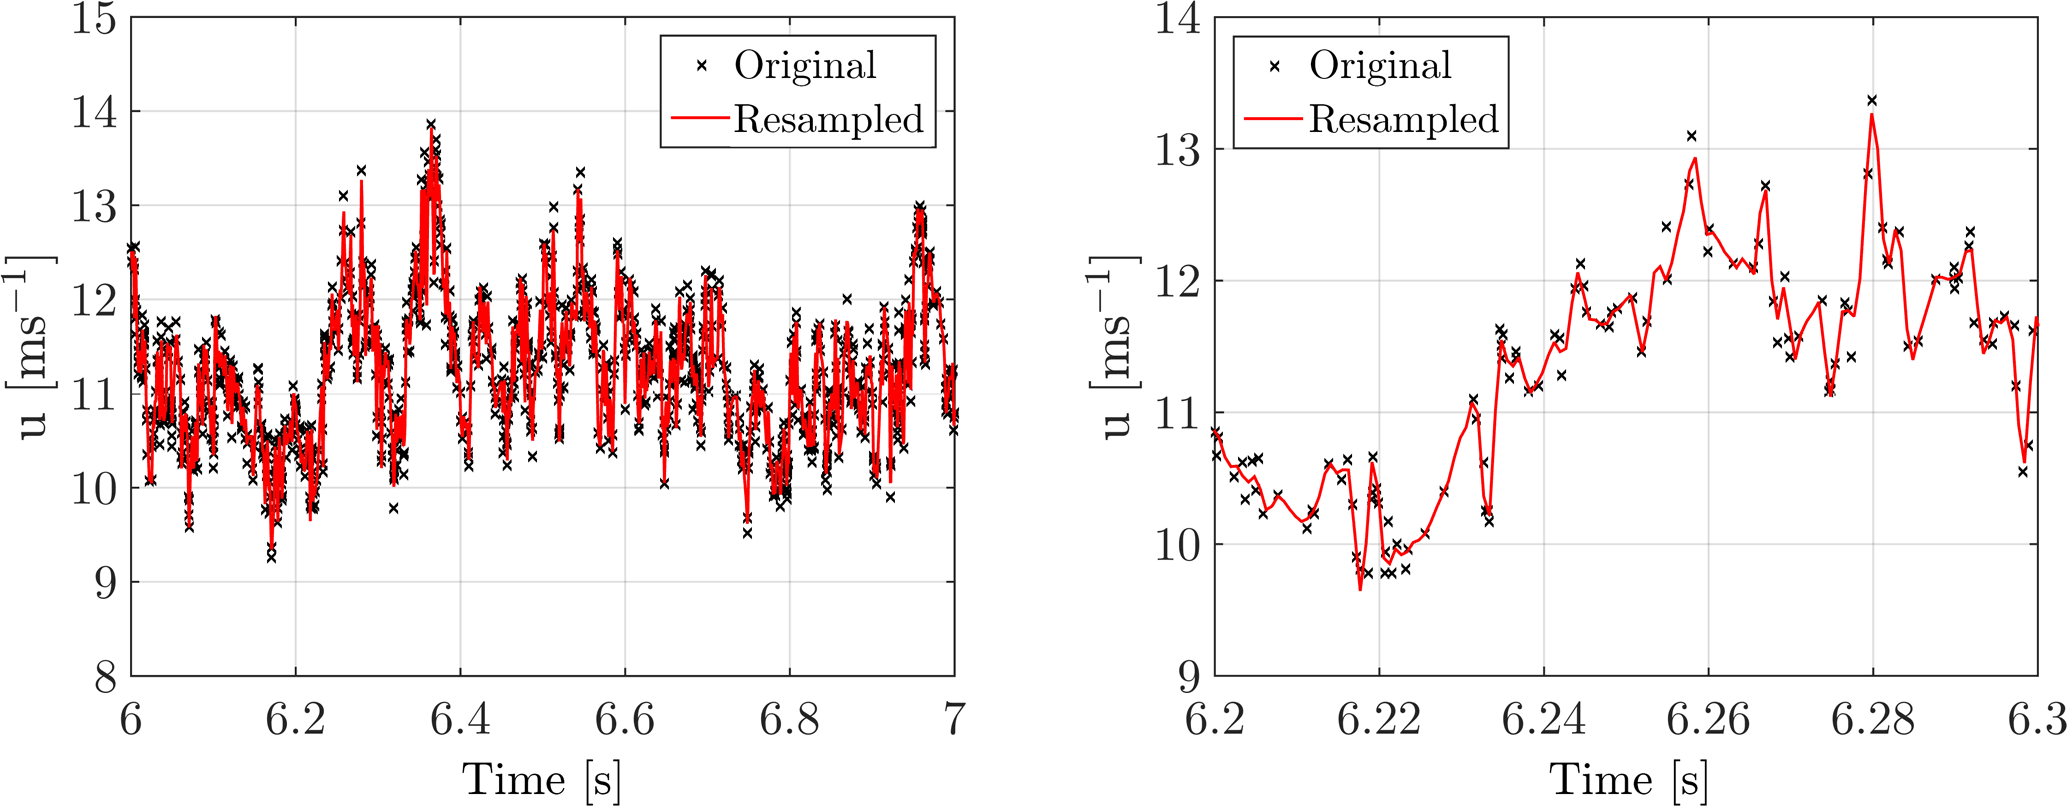
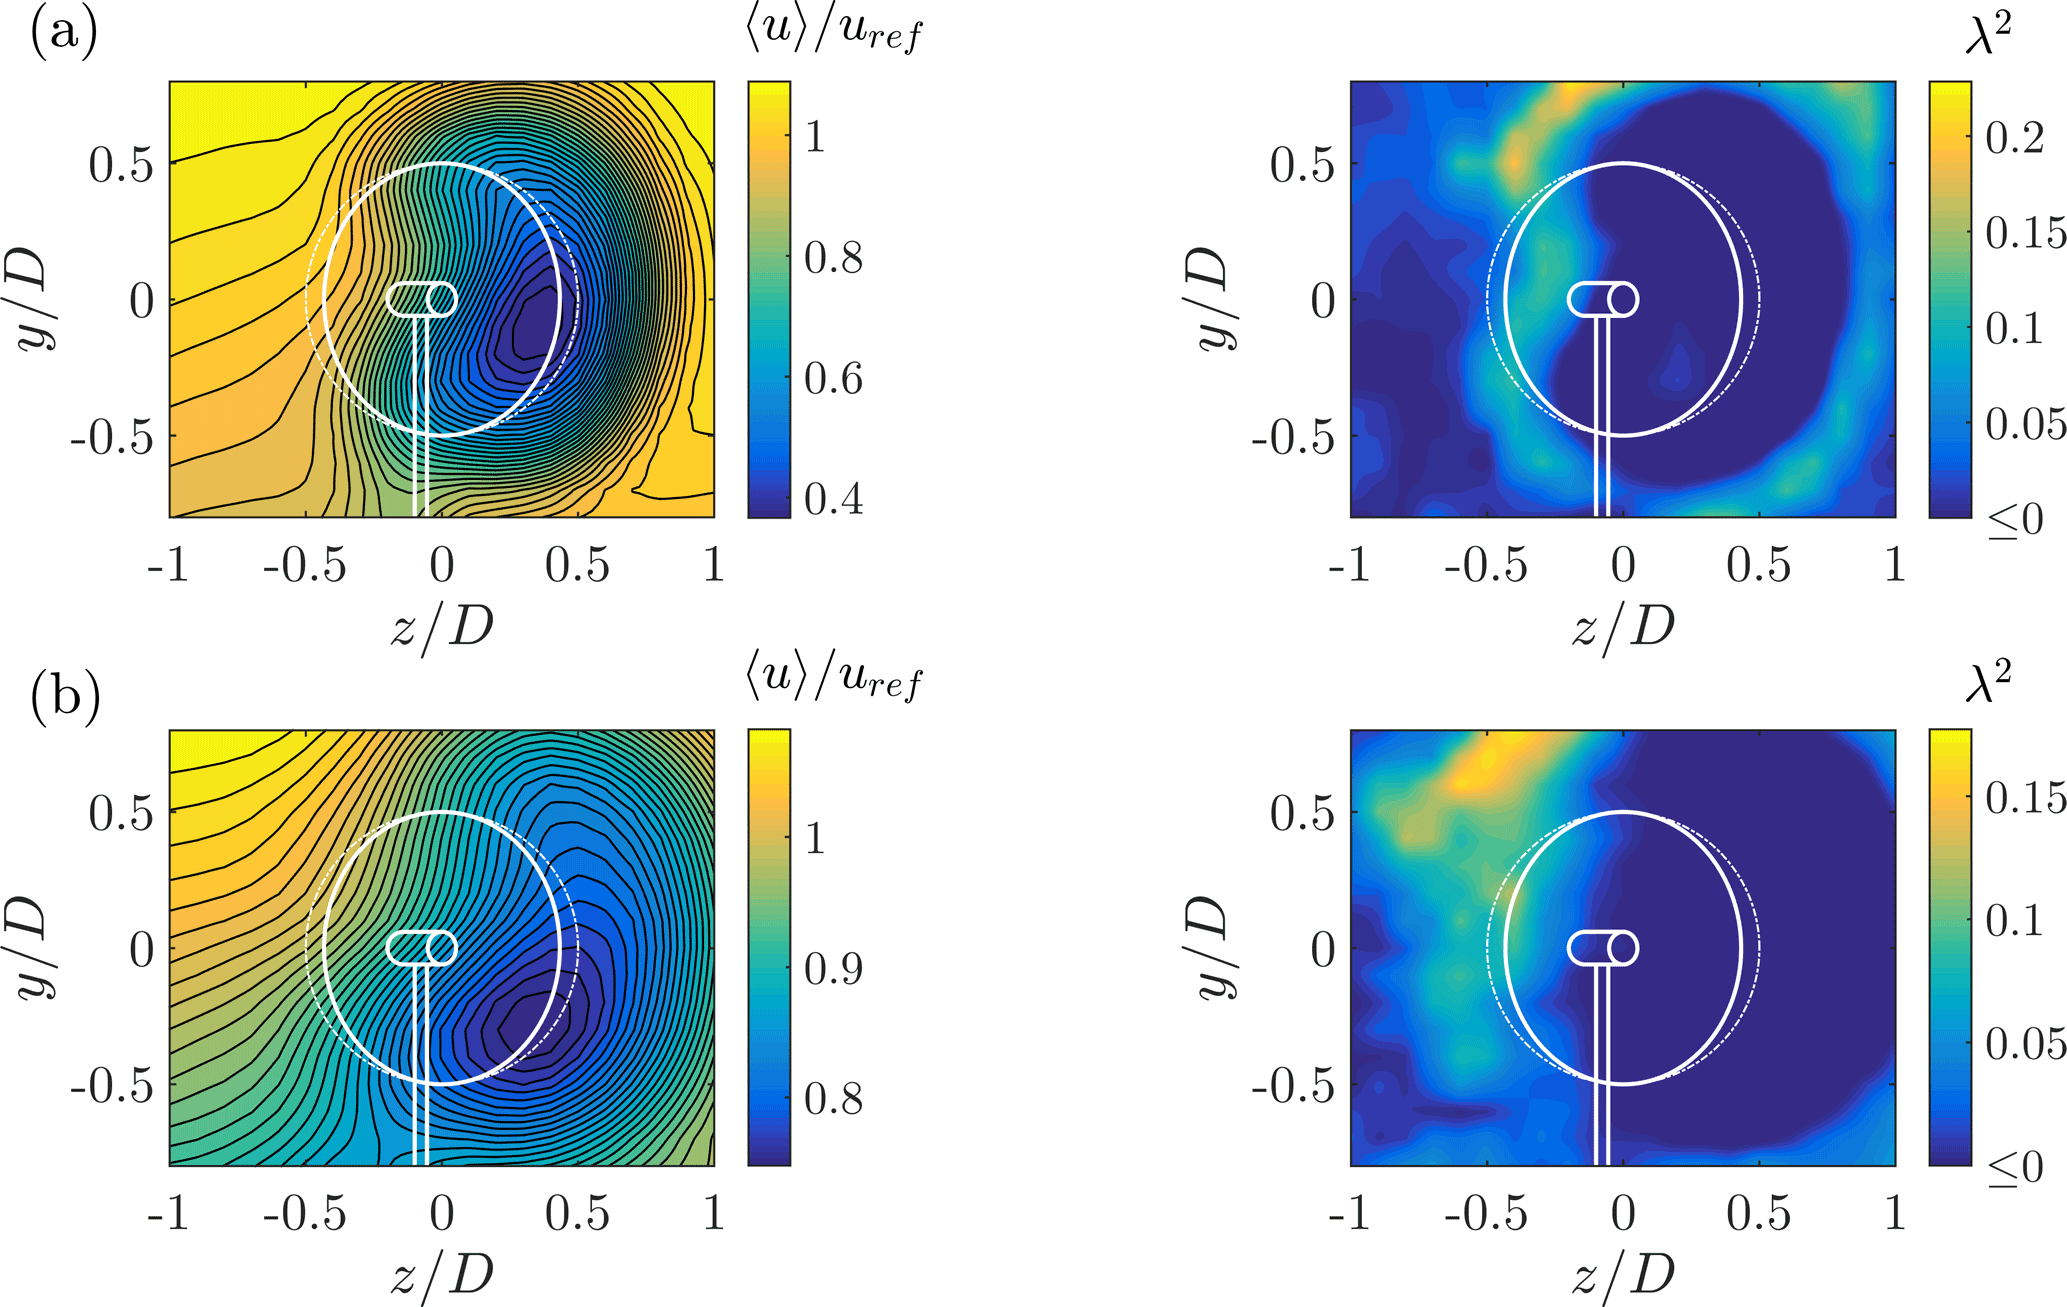
Figure B1LES data of the wakes 3D (a) and 6D (b) behind the ForWind turbine at γ=30∘. In contrast to the experiments presented in this paper, the inflow in the LES domain features a vertical shear with comparable turbulence intensity. The timescales of τ for the λ2 calculations correspond to the length scale of the rotor diameter.
Within the scope of the blind test 5 project, LES simulations of the ForWind turbine in a very comparable setup were performed, where the inflow features a vertical shear as opposed to the experiments shown in this paper. The incompressible flow solver caffa3d.MBRi as described by Mendina et al. (2014) and Draper et al. (2016) was used to obtain the results shown in Fig. B1. The turbine was modeled by actuator lines. The top row shows ; is shown beneath. The contours of 〈u〉∕uref and λ2 reveal very similar results to the experimental data. Qualitatively, it can be concluded that the outer ring of high λ2 values and thus heavy-tailed distributions of velocity increments that surrounds the velocity deficit of a wake can be correctly predicted in LES simulations.
The authors declare that they have no conflict of interest.
The authors thank Marín Draper and Andrés Guggeri, Universidad de la
República, Uruguay, for performing the LES simulation and providing the
data. Parts of this project are funded by the Ministry for Science and Culture
of Lower Saxony through the funding initiative “Niedersächsisches Vorab”. The authors also thank the Reiner
Lemoine Foundation for further funding.
Edited by: Gerard J. W. van Bussel
Reviewed by: three
anonymous referees
Abdulrahim, A., Anik, E., and Uzol, O.: Experimental Investigation of the Wake Flow Field of a Model Wind Turbine Rotor with Tip Injection, in: 33rd Wind Energy Symposium, January, 1–10, American Institute of Aeronautics and Astronautics, Reston, VA, USA, https://doi.org/10.2514/6.2015-0498, 2015. a
Amidror, I.: Scattered data interpolation methods for electronic imaging systems: a survey, J. Electron. Imaging, 11, 157–177, https://doi.org/10.1117/1.1455013, 2002. a
Bak, C., Zahle, F., Bitsche, R., and Kim, T.: The DTU 10-MW reference wind turbine, Danish wind power Research 2013, available at: http://orbit.dtu.dk/services/downloadRegister/55645274/ (last access: 12 May 2018), 2013. a
Barthelmie, R. J., Pryor, S., Frandsen, S. T., Hansen, K. S., Schepers, J., Rados, K., Schlez, W., Neubert, A., Jensen, L., and Neckelmann, S.: Quantifying the impact of wind turbine wakes on power output at offshore wind farms, J. Atmos. Ocean. Tech., 27, 1302–1317, 2010. a
Bartl, J. and Sætran, L.: Blind test comparison of the performance and wake flow between two in-line wind turbines exposed to different turbulent inflow conditions, Wind Energ. Sci., 2, 55–76, https://doi.org/10.5194/wes-2-55-2017, 2017. a
Bartl, J., Mühle, F., Schottler, J., Sætran, L., Peinke, J., Adaramola, M., and Hölling, M.: Wind tunnel experiments on wind turbine wakes in yaw: Effects of inflow turbulence and shear, Wind Energ. Sci. Discuss., https://doi.org/10.5194/wes-2017-59, in review, 2018. a, b
Bastankhah, M. and Porté-Agel, F.: Experimental and theoretical study of wind turbine wakes in yawed conditions, J. Fluid Mech., 806, 506–541, https://doi.org/10.1017/jfm.2016.595, 2016. a, b, c, d
Berg, J., Natarajan, A., Mann, J., and Patton, E. G.: Gaussian vs non-Gaussian turbulence: impact on wind turbine loads, Wind Energy, 19, 1975–1989, https://doi.org/10.1002/we.1963, 2016. a
Boettcher, F., Renner, C., Waldl, H. P., and Peinke, J.: On the statistics of wind gusts, Bound.-Lay. Meteorol., 108, 163–173, https://doi.org/10.1023/A:1023009722736, 2003. a
Bottasso, C. L., Campagnolo, F., and Petrović, V.: Wind tunnel testing of scaled wind turbine models: Beyond aerodynamics, J. Wind Eng. Ind. Aerod., 127, 11–28, 2014. a
Burton, T., Sharpe, D., Jenkins, N., and Bossanyi, E.: Wind Energy Handbook, John Wiley and Sons, West Sussex, UK, 2001. a, b
Campagnolo, F., Petrović, V., Bottasso, C., and Croce, A.: Wind tunnel testing of wake control strategies, in: Proceedings of the American Control Conference, vol. 2016, https://doi.org/10.1109/ACC.2016.7524965, 2016. a
Castaing, B., Gagne, Y., and Hopfinger, E. J.: Velocity probability density functions of high Reynolds number turbulence, Physica D, 46, 177–200, https://doi.org/10.1016/0167-2789(90)90035-N, 1990. a, b
Chen, T. and Liou, L.: Blockage corrections in wind tunnel tests of small horizontal-axis wind turbines, Exp. Therm. Fluid Sci., 35, 565–569, https://doi.org/10.1016/j.expthermflusci.2010.12.005, 2011. a, b
Chillà, F., Peinke, J., and Castaing, B.: Multiplicative Process in Turbulent Velocity Statistics: A Simplified Analysis, J. Phys. II, 6, 455–460, https://doi.org/10.1051/jp2:1996191, 1996. a
Draper, M., Guggeri, A., and Usera, G.: Validation of the Actuator Line Model with coarse resolution in atmospheric sheared and turbulent inflow, J. Phys. Conf. Ser., 753, 8, https://doi.org/10.1088/1742-6596/753/8/082007, 2016. a
Eriksen, P. E. and Krogstad, P. Å.: Development of coherent motion in the wake of a model wind turbine, Renew. Energ., 108, 449–460, https://doi.org/10.1016/j.renene.2017.02.031, 2017. a
España, G., Aubrun, S., Loyer, S., and Devinant, P.: Wind tunnel study of the wake meandering downstream of a modelled wind turbine as an effect of large scale turbulent eddies, J. Wind Eng. Ind. Aerod., 101, 24–33, 2012. a
Fleming, P., Gebraad, P. M., Lee, S., Wingerden, J.-W., Johnson, K., Churchfield, M., Michalakes, J., Spalart, P., and Moriarty, P.: Simulation comparison of wake mitigation control strategies for a two-turbine case, Wind Energy, 18, 2135–2143, https://doi.org/10.1002/we.1810, 2014a. a
Fleming, P. A., Gebraad, P. M. O., Lee, S., van Wingerden, J. W., Johnson, K., Churchfield, M., Michalakes, J., Spalart, P., and Moriarty, P.: Evaluating techniques for redirecting turbine wakes using SOWFA, Renew. Energ., 70, 211–218, https://doi.org/10.1016/j.renene.2014.02.015, 2014b. a, b
Fleming, P., Annoni, J., Shah, J. J., Wang, L., Ananthan, S., Zhang, Z., Hutchings, K., Wang, P., Chen, W., and Chen, L.: Field test of wake steering at an offshore wind farm, Wind Energ. Sci., 2, 229–239, https://doi.org/10.5194/wes-2-229-2017, 2017. a
Frisch, U.: Turbulence: the legacy of A.N. Kolmogorov, vol. 1, Cambridge university press, Cambridge, UK, https://doi.org/10.1017/S0022112096210791, 1995. a, b, c
Gebraad, P. M. O., Teeuwisse, F. W., van Wingerden, J. W., Fleming, P. A., Ruben, S. D., Marden, J. R., and Pao, L. Y.: Wind plant power optimization through yaw control using a parametric model for wake effects-a CFD simulation study, Wind Energy, 19, 95–114, https://doi.org/10.1002/we.1822, 2014. a
Howland, M. F., Bossuyt, J., Martínez-Tossas, L. A., Meyers, J., and Meneveau, C.: Wake structure in actuator disk models of wind turbines in yaw under uniform inflow conditions, J. Renew. Sustain. Ener., 8, 4, https://doi.org/10.1063/1.4955091, 2016. a, b
Jiménez, Á., Crespo, A., and Migoya, E.: Application of a LES technique to characterize the wake deflection of a wind turbine in yaw, Wind Energy, 13, 559–572, 2010. a, b
Jonkman, J. M., Butterfield, S., Musial, W., and Scott, G.: Definition of a 5-MW reference wind turbine for offshore system development, National Renewable Energy Laboratory Golden, CO, USA, 2009. a
Liu, L., Hu, F., Cheng, X.-L., and Song, L.-L.: Probability Density Functions of Velocity Increments in the Atmospheric Boundary Layer, Bound.-Lay. Meteorol., 134, 243–255, https://doi.org/10.1007/s10546-009-9441-z, 2010. a
Mathieu, J. and Scott, J.: An introduction to turbulent flow, Cambridge University Press, Cambridge, UK, 2000. a
Medici, D. and Alfredsson, P.: Measurements on a wind turbine wake: 3D effects and bluff body vortex shedding, Wind Energy, 9, 219–236, 2006. a, b, c
Mendina, M., Draper, M., Kelm Soares, A. P., Narancio, G., and Usera, G.: A general purpose parallel block structured open source incompressible flow solver, Cluster Comput., 17, 231–241, https://doi.org/10.1007/s10586-013-0323-2, 2014. a
Milan, P., Wächter, M., and Peinke, J.: Turbulent character of wind energy, Phys. Rev. Lett., 110, 1–5, https://doi.org/10.1103/PhysRevLett.110.138701, 2013. a, b, c
Morales, A., Wächter, M., and Peinke, J.: Characterization of wind turbulence by higher-order statistics, Wind Energy, 15, 391–406, https://doi.org/10.1002/we.478, 2012. a, b
Mücke, T., Kleinhans, D., and Peinke, J.: Atmospheric turbulence and its influence on the alternating loads on wind turbines, Wind Energy, 14, 301–316, https://doi.org/10.1002/we.422, 2011. a, b, c
Pierella, F. and Saetran, L.: Wind tunnel investigation on the effect of the turbine tower on wind turbines wake symmetry, Wind Energy, 17, 657–669, https://doi.org/10.1002/we.2120, 2017. a
Rockel, S., Camp, E., Schmidt, J., Peinke, J., Cal, R. B., and Hölling, M.: Experimental study on influence of pitch motion on the wake of a floating wind turbine model, 7, 1954–1985, https://doi.org/10.3390/en7041954, 2014. a
Rockel, S., Peinke, J., Hölling, M., and Cal, R. B.: Wake to wake interaction of floating wind turbine models in free pitch motion: An eddy viscosity and mixing length approach, Renew. Energ., 85, 666–676, https://doi.org/10.1016/j.renene.2015.07.012, 2016. a
Schottler, J., Hölling, A., Peinke, J., and Hölling, M.: Wind tunnel tests on controllable model wind turbines in yaw, 34th Wind Energy Symposium, 4–8 January 2016, San Diego, CA, USA, p. 1523, 2016. a
Schottler, J., Hölling, A., Peinke, J., and Hölling, M.: Brief communication: On the influence of vertical wind shear on the combined power output of two model wind turbines in yaw, Wind Energ. Sci., 2, 439–442, https://doi.org/10.5194/wes-2-439-2017, 2017a. a
Schottler, J., Mühle, F., Bartl, J., Peinke, J., Adaramola, M. S., Sætran, L., and Hölling, M.: Comparative study on the wake deflection behind yawed wind turbine models, J. Phys. Conf. Ser., 854, 012032, https://doi.org/10.1088/1742-6596/854/1/012032, 2017b. a, b, c, d, e
Schottler, J., Reinke, N., Hölling, A., Whale, J., Peinke, J., and Hölling, M.: On the impact of non-Gaussian wind statistics on wind turbines – an experimental approach, Wind Energ. Sci., 2, 1–13, https://doi.org/10.5194/wes-2-1-2017, 2017c. a, b, c, d
Schottler, J., Bartl, J., and Mühle, F.: Wind tunnel experiments on wind turbine wakes in yaw [Data set], Zenodo, available at: https://doi.org/10.5281/zenodo.1193656, last access: 4 May 2018.
Trujillo, J. J., Seifert, J. K., Würth, I., Schlipf, D., and Kühn, M.: Full-field assessment of wind turbine near-wake deviation in relation to yaw misalignment, Wind Energ. Sci., 1, 41–53, https://doi.org/10.5194/wes-1-41-2016, 2016. a, b
van Kuik, G. A. M., Peinke, J., Nijssen, R., Lekou, D., Mann, J., Sørensen, J. N., Ferreira, C., van Wingerden, J. W., Schlipf, D., Gebraad, P., Polinder, H., Abrahamsen, A., van Bussel, G. J. W., Sørensen, J. D., Tavner, P., Bottasso, C. L., Muskulus, M., Matha, D., Lindeboom, H. J., Degraer, S., Kramer, O., Lehnhoff, S., Sonnenschein, M., Sørensen, P. E., Künneke, R. W., Morthorst, P. E., and Skytte, K.: Long-term research challenges in wind energy – a research agenda by the European Academy of Wind Energy, Wind Energ. Sci., 1, 1–39, https://doi.org/10.5194/wes-1-1-2016, 2016. a
Vollmer, L., Steinfeld, G., Heinemann, D., and Kühn, M.: Estimating the wake deflection downstream of a wind turbine in different atmospheric stabilities: an LES study, Wind Energ. Sci., 1, 129–141, https://doi.org/10.5194/wes-1-129-2016, 2016. a, b
In Schottler et al. (2017b), the quantification was carried out for a sheared inflow. Other aspects of the setup were equal.