the Creative Commons Attribution 4.0 License.
the Creative Commons Attribution 4.0 License.
 | 15 Aug 2018
Wind tunnel study on power output and yaw moments for two yaw-controlled model wind turbines
Jan Bartl
Franz Mühle
Lars Sætran
In this experimental wind tunnel study the effects of intentional yaw misalignment on the power production and loads of a downstream turbine are investigated for full and partial wake overlap. Power, thrust force and yaw moment are measured on both the upstream and downstream turbine. The influence of inflow turbulence level and streamwise turbine separation distance are analyzed for full wake overlap. For partial wake overlap the concept of downstream turbine yawing for yaw moment mitigation is examined for different lateral offset positions.
Results indicate that upstream turbine yaw misalignment is able to increase the combined power production of the two turbines for both partial and full wake overlap. For aligned turbine setups the combined power is increased between 3.5 % and 11 % depending on the inflow turbulence level and turbine separation distance. The increase in combined power is at the expense of increased yaw moments on both the upstream and downstream turbine. For partial wake overlap, yaw moments on the downstream turbine can be mitigated through upstream turbine yawing. Simultaneously, the combined power output of the turbine array is increased. A final test case demonstrates benefits for power and loads through downstream turbine yawing in partial wake overlap. Yaw moments can be decreased and the power increased by intentionally yawing the downstream turbine in the opposite direction.
- Article
(2932 KB) - Full-text XML
- BibTeX
- EndNote


In wind farms the individual wind turbines interact aerodynamically through their wakes. Besides significant power losses, rotors exposed to upstream turbines' wakes experience higher unsteady loading (Kim et al., 2015). The reduced power and increased rotor loads are dependent on the downstream turbine's lateral and streamwise location in the wake, the upstream turbine's control settings and the characteristics of the incoming wind. The inflow characteristics are governed by the atmospheric stability, in which the turbulence level and the degree of shear and veer are important parameters. In combination with the wind farm layout, the site-dependent wind statistics, such as wind speed and direction distributions, define the occurrence for downstream turbines to be fully or partially exposed to the upstream turbine's wake.
In order to mitigate power losses and wake-induced loads on downstream turbines, different upstream turbine control strategies have recently been suggested (Gebraad et al., 2015; Knudsen et al., 2014). These include methods of reducing the axial induction of an upstream turbine and thus also mean and turbulent gradients in the wake (Annoni et al., 2016; Bartl and Sætran, 2016) as well as wake redirection techniques (Fleming et al., 2015). The most discussed wake deflection mechanisms include individual pitch angle control, tilt angle variation and yaw angle actuation. In a computational fluid dynamics (CFD) study Fleming et al. (2015) compare these techniques with regards to power gains and out-of-plane blade bending loads using a two-turbine setup. Individual pitch control was observed to cause high structural loads. Most current turbine designs do not feature tilt mechanisms, while yaw actuation is concluded to be a promising technique due to its simple implementability. As all modern wind turbines are equipped with yaw actuators, intentional yaw misalignment can be used to laterally deflect the wake flow and potentially increase the wind farm power output.
A number of recent studies have focused on the wake characteristics behind a yawed wind turbine. In a combined experimental and computational study Howland et al. (2016) measured the wake of yawed small drag disc and conducted a large-eddy simulation (LES) behind an actuator-disc/line-modeled rotor. They discussed different quantifications for wake deflection and characterized the formation of a curled wake shape due to a counter-rotating vortex pair. A similar wake shape was found in a LES study by Vollmer et al. (2016), who found a significant variation of wake shape and deflection depending on the atmospheric stability. The yawed wake characteristics' dependency on inflow turbulence and shear were investigated in an experimental study by Bartl et al. (2018). The inflow turbulence level was observed to influence the shape and deflection of the wake, in contrast to a moderate shear in the inflow. Schottler et al. (2018) highlight the importance of considering non-Gaussian distributions of velocity increments in wind farm control and layout optimizations. A ring of strongly intermittent flow is shown to surround the mean velocity deficit locations, suggesting a much wider wake expansion as based on the mean velocity. An extensive theoretical and experimental study on yaw wakes was performed by Bastankhah and Porté-Agel (2016). They presented a theoretical description for the formation of the counter-rotating vortex pair in the wake and developed a sophisticated analytical model for the far wake of a yawed turbine. Including inflow turbulence as an additional input parameter makes Bastankhah and Porté-Agel's model a favorable alternative to the wake deflection model by Jiménez et al. (2010).
Moreover, various research has investigated the potential of overall wind farm power gains through intentional yaw misalignment. An experimental study by Adaramola and Krogstad (2011) on two aligned model wind turbines () demonstrated an increase in combined efficiency with increasing upstream turbine yaw angle. For a yaw angle of 30∘, they measured an increase of 12 % in combined power compared to the reference case at 0∘. For the same separation distance Schottler et al. (2016) measured a combined power increase of about 4 % for an upstream turbine yaw angle of . Their experimental study on two aligned model turbines furthermore pointed out clear asymmetries of the downstream turbine power output with regards to the upstream turbine yaw angle. Another experimental study on three model wind turbines was presented by Campagnolo et al. (2016), who measured a combined power increase of 21 % for a lateral offset of between the turbines. Comprehensive studies on yaw misalignment for optimized full wind farm control haven been presented by Fleming et al. (2014) and Gebraad et al. (2016). They analyzed wake mitigation strategies by using both the LES code SOWFA and a parametric wake model. A comprehensive full-scale study by McKay et al. (2013) investigated the connection of yaw alignment and power output of a downstream turbine operated in the wake of an upstream turbine. They found a power increase for downstream turbines, which independently misaligned their yaw angle from the main wind direction when operated in a partial wake.
Most of these studies focus on the possibilities for power optimization through yaw control; however, the discussion of increased structural loads is often left open. Yet yaw misalignment of an undisturbed turbine was observed to increase unsteady loading on the yawed rotor. In a simulation by Kragh and Hansen (2014) these loads are quantified for different inflow conditions. It is furthermore shown that load variations due to wind shear can potentially be alleviated by yaw misalignment. Load characteristics on a yawed model turbine rotor were compared to various computational approaches by Schepers et al. (2014). Their comparisons revealed modeling deficiencies, while shedding light on complex unsteady-flow phenomena during yaw. In a recent paper by Damiani et al. (2018) damage equivalent loads and extreme loads under yaw misalignment are measured and predicted for a fully instrumented wind turbine. They observed rather complex, inflow-dependent load distributions for yaw angle offsets. In a computational setup of 10 aligned turbines Andersen et al. (2017) investigated the influence of inflow conditions and turbine spacing on yaw moments of downstream turbines operated in the wake. The study shows unexpected load peaks for every second or third downstream turbine in below-rated operating conditions. A way to utilize measured rotor loads such as yaw moments to estimate rotor yaw misalignment, inflow shear or partial wake rotor operation is investigated by Schreiber et al. (2016). Using a computational framework of a wake model, a blade element momentum (BEM) model for power and loads, and a gradient-based optimizer, (van Dijk et al., 2017) investigated the effects of yaw misalignment on power production and loads in full and partial wake overlap. They found that upstream turbine yaw misalignment is able to increase the total power production of their modeled wind farm, while reducing the loads in partial wake overlap.
The objective of the present study is to analyze potentials of yaw control for the often contradicting goals of combined power gains and load mitigation. Balancing the benefits of power gains and costs of increased rotor loads is of utmost importance for the design of cost-effective wind farm control strategies. For this purpose the parameters turbine separation distance x∕D, lateral turbine offset Δz∕D and turbine yaw settings γT1 and γT2 are systematically varied in this wind tunnel experiment. Aside from power output and rotor thrust, the yaw moments acting on the individual rotors are measured. Yaw moments are a representation of the imbalance of the forces acting on a rotor blade during the course of one rotation. High values of yaw moments thus indicate increased unsteady blade loading at a frequency corresponding to the rotational speed. Special focus is given to the concept of downstream turbine yawing in partial-wake situations for the purpose of load reduction and combined power gains. Together with the inflow-dependent wake flow measurements using the same experimental setup presented in Bartl et al. (2018), this study completes the link between detailed wake flow characteristics and power, yaw moments and thrust forces on a turbine operated in the wake.
2.1 Wind turbine models
Two wind turbine models of exactly the same rotor geometry were used for this study. The rotor was designed based on the NREL S826 airfoil and has a total diameter of D=0.894 m. The tower and nacelle structure of the upstream turbine (T1) is slightly slimmer than that of the downstream turbine (T2), in order to minimize the effect on the wake flow behind the yawed upstream turbine. The maximum power point of both turbines is reached at a tip speed ratio of in undisturbed inflow. In this experiment T2 is controlled to its optimum power point, which strongly varies for different positions and upstream turbine operational parameters. The exact geometry and detailed performance curves of T1 are described in Bartl et al. (2018), while T2's characteristics can be found in Bartl and Sætran (2017). In contrast to most other turbines, the investigated model turbines rotate counterclockwise.
The experiments were performed in the closed-loop wind tunnel at the Norwegian University of Science and Technology (NTNU) in Trondheim, Norway. The tunnel's cross-section measures 2.71 m in width, 1.81 m in height and 11.15 m in length. The turbine models are operated at a blade tip Reynolds numbers of approximately Retip≈105.
Moreover, about 12.8 % of the wind tunnel's cross sectional area is blocked by the turbines' rotor-swept area. The wind tunnel width measures about 3 times the turbine's rotor diameter, which leaves sufficient space for lateral wake deflection and offset positions for T2. However, a speed-up of the flow in freestream areas around the rotors is observed due to blockage effects as described in detail in Bartl et al. (2018). The impact of the wind tunnel blockage on the wake expansion behind the same model turbine rotor has furthermore been investigated in a computational study by Sarlak et al. (2016). For high blockage ratios, correction models (e.g., by Sørensen et al., 2006, or Ryi et al., 2015) for the power output are available. In this study, however, no correction models have been applied, in order not to add another dimension of modeling uncertainty to the results.
2.2 Inflow conditions
The influence of different inflow turbulence levels is investigated in this study. For this purpose the turbines are exposed to an inflow of low turbulence intensity TIA=0.23 % (inflow A) as well as high turbulence intensity TIB=10.0 % (inflow B). Inflow B is generated by a static grid at the wind tunnel inlet () and is measured to the amount TIB=10.0 % at the location of the upstream turbine (). The grid-generated turbulence decays with increasing downstream distance to about TIB=5.5 % at and to TIB=4.0 % at . The profiles of streamwise mean velocity and turbulence intensity measured in the empty wind tunnel for different downstream positions are presented in Bartl et al. (2018). Inflow A is assessed to be uniform within ±0.8 % over the rotor-swept area. A velocity variation of ±2.5 % is measured at for inflow B, as the footprint of the grid's single bars is still detectable. At , however, the grid-generated turbulent flow is seen to be uniform within ±1.0 %. Both test cases were performed at the constant reference velocity of .
2.3 Measurement techniques
The mechanical power of both rotors was measured in separate steps with an HBM torque transducer of the type “T20WN/2NM”, which is installed in the nacelle of the downstream turbine T2. The transducer is connected to the rotor shaft through flexible couplings. An optical photo cell inside the nacelle makes the rotor's rotational speed assessable. On the test rig of T1 the rotational speed is controlled via a servo motor, ensuring the same power and load characteristics as for T2.
For the purpose of thrust force and yaw moment measurements the model turbines are separately installed on a six-component force balance by Carl Schenck AG. By constantly recording signals obtained from the three horizontal force cells, the yaw moments referring to the rotor center can be calculated. For the assessment of the rotor thrust, the drag force on tower and nacelle is measured isolated and then subtracted from the total thrust. No such correction is applied for the assessment of the yaw moments.
2.4 Statistical measurement uncertainties
The statistical measurement uncertainties for power coefficients, thrust coefficient and normalized yaw moments have been calculated following the procedure described by Wheeler and Ganji (2004). Random errors are computed from repeated measurements of various representative measurement points based on a 95 % confidence interval. Furthermore, the match of power and thrust values of the baseline cases (e.g., , , ) with previous results (e.g., by Bartl and Sætran, 2016, 2017) has been checked for consistency.
For the purpose of clarity, error bars are not shown in the resulting graphs in Sect. 3. Instead, a short overview of uncertainties for the different measures is given here. The total uncertainty in T1's power coefficient is 0.011 (1.9 %) for non-yawed operation, rising up to about 0.017 (3.9 %) for a yaw angle of . The uncertainty in T1's thrust coefficient is assessed to be very similar, varying from 0.013 (1.4 %) to 0.018 (3.1 %) for yaw angles 0∘ and , respectively. The uncertainty in normalized yaw moments is 0.0032, which corresponds to almost 15 % of the absolute measurement value at . Due to very small absolute values of the yaw moments, the relative uncertainty is rather high. In the case of T2, the uncertainties are presented representatively for the aligned test case, in which the upstream turbine is operated at and T2 is located at and operated at . The total uncertainties in power and thrust coefficient are 0.0060 (2.5 % of the absolute CP value) and 0.0070 (0.9 % of the absolute CT value), respectively. The normalized yaw moment of the downstream turbine for this case amounts to 0.0019 (about 8 % of the absolute value).
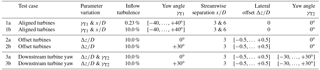
2.5 Test case definition
Three main test cases are investigated in this study. In the first test case the two model turbines are installed in an aligned arrangement in the wind tunnel; i.e., T2 is immersed in the full wake of T1 (for ). The upstream turbine's yaw angle is then systematically varied at nine different values . Moreover, the streamwise separation distance between the turbines is varied from to . Finally, the inflow turbulence intensity is varied from TIA=0.23 % (inflow A) to TIB=10.0 % (inflow B).
In the second test case, the effect of the lateral offset position Δz∕D of the downstream turbine T2 in the wake of an upstream turbine T1 is investigated. That means that T2 is in most cases exposed to partial-wake situations. For this purpose, the lateral offset is set to seven different positions in the range of . This is done for two upstream turbine yaw angles: and . The turbine separation distance is kept constant at , and only the highly turbulent inflow condition (inflow B) is investigated.
In the third and final test case the downstream turbine yaw angle γT2 is varied as an additional parameter while it is operated at different lateral offset positions Δz∕D. This concept intends to demonstrate the possibility for yaw moment mitigation in partial-wake situations by opposite-direction yawing of the downstream turbine. In this test case T2 is therefore operated at 13 different yaw angles in the range of . An overview of all investigated test cases is presented in Table 1.
For all test cases the power coefficient CP, thrust coefficient CT and normalized yaw moment are assessed on T1 and T2. Note that the coefficients for both turbines are normalized with the reference inflow velocity Uref measured far upstream of the turbine array at . The power coefficient is the measured mechanical power normalized with the kinetic power of the wind in a streamtube of the same diameter:
The thrust coefficient is defined as the thrust force normal to the rotor plane normalized with the momentum of the wind in a streamtube:
The yaw moment My is normalized in a similar way to the thrust force with an additional rotor diameter D to account for the normalization of the yaw moment's lever:
3.1 Operating characteristics of T1
At first the yaw-angle-dependent operating characteristics of the upstream wind turbine are presented for two inflow conditions in Fig. 1. The model turbine is operated at a tip speed ratio of λT1=6.0 for all yaw angles. There, the power coefficient is assessed to be maximum at λT1=6.0 for all yaw angles from γT1=0 to . A slight shift towards a lower optimum tip speed ratio of λT1=5.5 is measured for (not shown in graph). As the difference in total power coefficient is observed to be very small, the upstream turbine is also constantly operated at λT1=6.0 for these yaw angles. The downstream turbine shows exactly the same operating characteristics when operated in undisturbed inflow. For measurements showing the power and thrust coefficient depending on the tip speed ratio λT1, the interested reader is referred to Bartl et al. (2018).
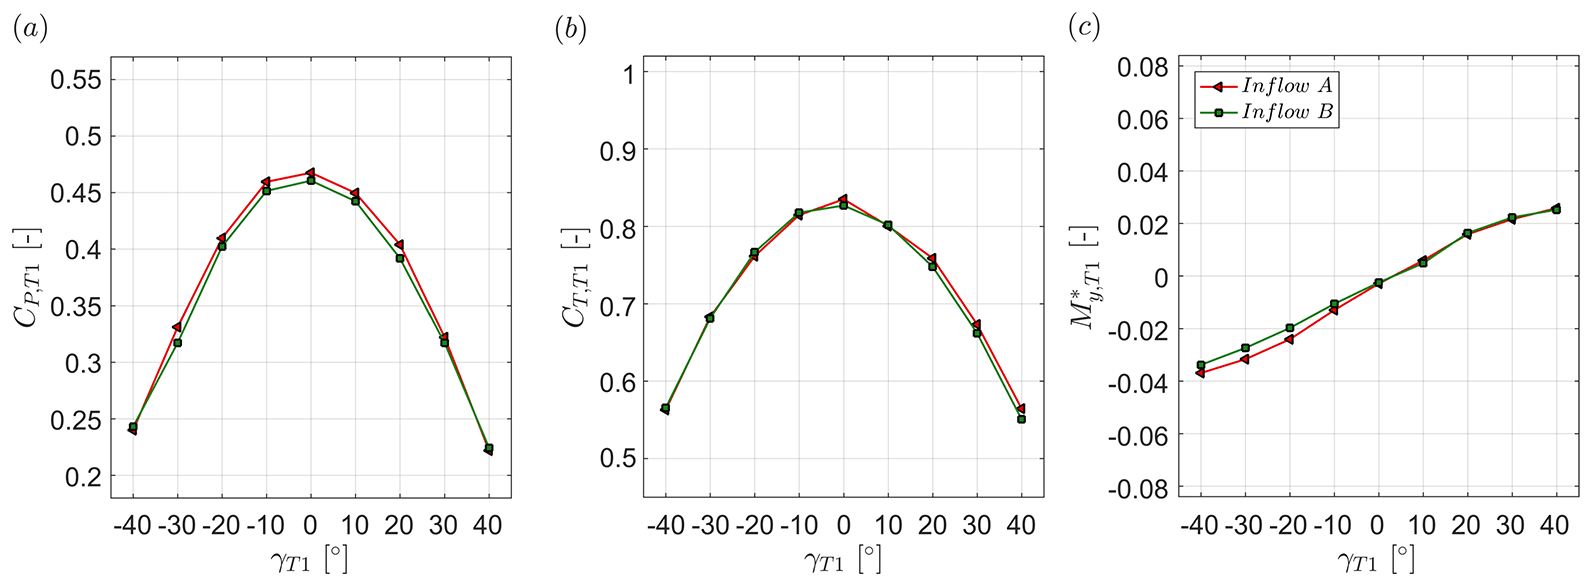
Figure 1(a) Power coefficient CP,T1, (b) thrust coefficient CT,T1 and (c) normalized yaw moment of the undisturbed upstream turbine T1 for different inflow conditions. The turbine is operated at for all yaw angles.
At γT1=0 the upstream turbine reaches a power coefficient of about for both inflow conditions. It is observed that an increase in inflow turbulence results in the same performance characteristics. As discussed by Bartl et al. (2018), the decrease in power coefficient can be approximated when the turbine yaw angle is varied. The thrust coefficient's reduction through yawing is observed to match well with . Despite the commonly assumed exponent of α=3 for the power coefficient , Micallef and Sant (2016) refer to different values of α between 1.8 and 5 measured in different full-scale tests. The measured relations of our study, however, correspond well to previous measurements on the same rotor by Krogstad and Adaramola (2012) and another experimental study on a smaller rotor by Ozbay et al. (2012). Another recent experimental study on a very small rotor by Bastankhah and Porté-Agel (2017) confirmed the α=3 for the power coefficient but found a slightly smaller exponent of β=1.5 for the thrust coefficient.
The normalized yaw moment shows an almost linear behavior around the origin. However, minor asymmetries between positive and corresponding negative yaw angles are observed. These asymmetries are slightly stronger for inflow A (TIA=0.23 %). Although it is not entirely clear where these stem from, the only reasonable source for an asymmetric load distribution in an uniform inflow is the rotor's interaction with the turbine tower. In the course of a revolution, the blades of a yawed turbine experience unsteady-flow conditions, i.e., fluctuations in angle of attack and relative velocity. When superimposing an additional low-velocity zone, tower shadow or shear for example, the yaw symmetry is disturbed. Asymmetric load distributions for turbines exposed to sheared inflow were recently reported by Damiani et al. (2018). They showed that vertical wind shear causes asymmetric distributions of angle of attack and relative flow velocity in the course of a blade revolution. They link these to rotor loads and conclude further consequences on wake characteristics and wind farm control strategies.

Figure 2Top view of the aligned downstream turbine operated in the wake of an upstream turbine at the two different positions: and . The wake flow is indicated for (a) and (b) .
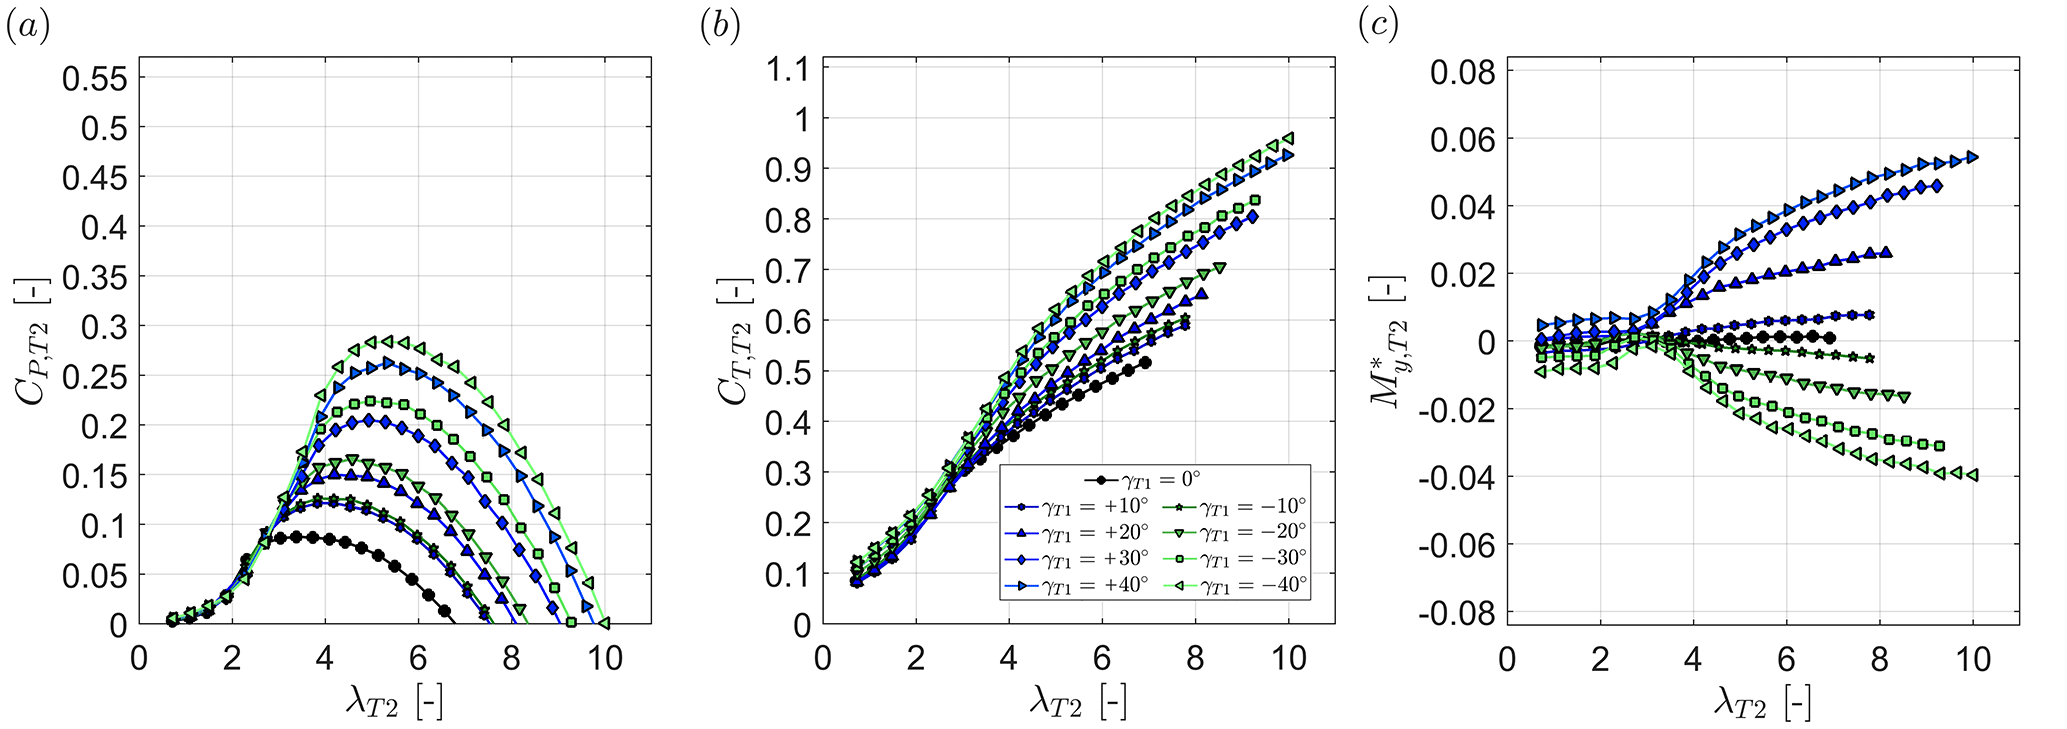
Figure 3Downstream turbine (a) power coefficient, (b) thrust coefficient and (c) normalized yaw moment as a function of its tip speed ratio λT2 for different upstream turbine yaw angles γT1. The downstream turbine T2 is located at . The turbines are exposed to inflow B.
3.2 Test case 1: aligned turbines
In the first test case both rotors are installed in the center of the wind tunnel at aligned with the main inflow direction. The downstream turbine position is varied from to , while the upstream turbine yaw angle is systematically changed in steps of in the range of . Figure 2 shows two example cases, in which the downstream turbine is operated in the upstream turbine's wake for and . Positive yaw is defined as indicated in Fig. 2. The sketched wake flow contours in the x–z plane at hub height are included for illustrative purposes. The location of the wake flow as sketched in gray is roughly estimated from previously performed measurements as presented in Bartl et al. (2018). The results for the downstream turbine CP,T2, CT,T2 and at inflow B dependent upon its tip speed ratio λT2 are shown in Fig. 3. The downstream turbine's power is observed to increase with an increasing absolute value of the upstream turbine yaw angle. As the wake is laterally deflected, the downstream turbine is partly exposed to higher flow velocities of the inflow. The power output of the downstream turbine is observed to be asymmetric with respect to the upstream turbine yaw angle. Higher downstream turbine power coefficients are measured for negative upstream turbine yaw angles. The optimum downstream turbine T2's operating point shifts to higher tip speed ratios λT2 the more kinetic energy is available in the wake. As the downstream turbine power coefficient refers to the constant far-upstream reference velocity Uref, the optimum operating conditions are measured for higher tip speed ratios as soon as the local inflow velocity increases. A corresponding asymmetry between positive and negative upstream turbine yaw angles is also observed in T2's thrust coefficient, showing higher values for negative upstream turbine yaw angles. The yaw moments experienced by the downstream turbine are observed to grow with increasing upstream turbine yaw angle. As expected, downstream turbine yaw moments are positive for positive upstream turbine yaw angles and vice versa. For low tip speed ratios, i.e., while approaching stalled flow conditions, the yaw moments are seen to be small and below 0.01. As soon as the flow is attached, the absolute value of the yaw moments is observed to strongly rise. Again, an asymmetry between negative and positive upstream turbine yaw angles is observed. The asymmetric wake deflection for positive and negative yaw angles is considered to be the main reason for the asymmetric distribution of T2's yaw moments. As discussed in an analysis of the wake flow behind a yawed turbine by Bartl et al. (2018), the overall wake displacement for positive and negative yaw angles was observed to be slightly asymmetric. The interaction of the rotor wake with the turbine tower is identified to be the main contributor for the asymmetric wake flow. This finding is supported by a previous study on the non-yawed wake by Pierella and Sætran (2017), in which they attributed a significant displacement of the wake center to the interaction with the turbine tower.
The effect of a variation in inflow turbulence level (TIA=0.23 % versus TIB=10.0 %) on the downstream turbine's CP,T2, CT,T2 and is shown in Fig. 4. The results are presented for varying upstream turbine yaw angle γT1. The downstream turbine T2 is operated at a λT2, for which CP,T2 was maximum for the specific conditions. Note that for neither thrust nor yaw moments were measured.
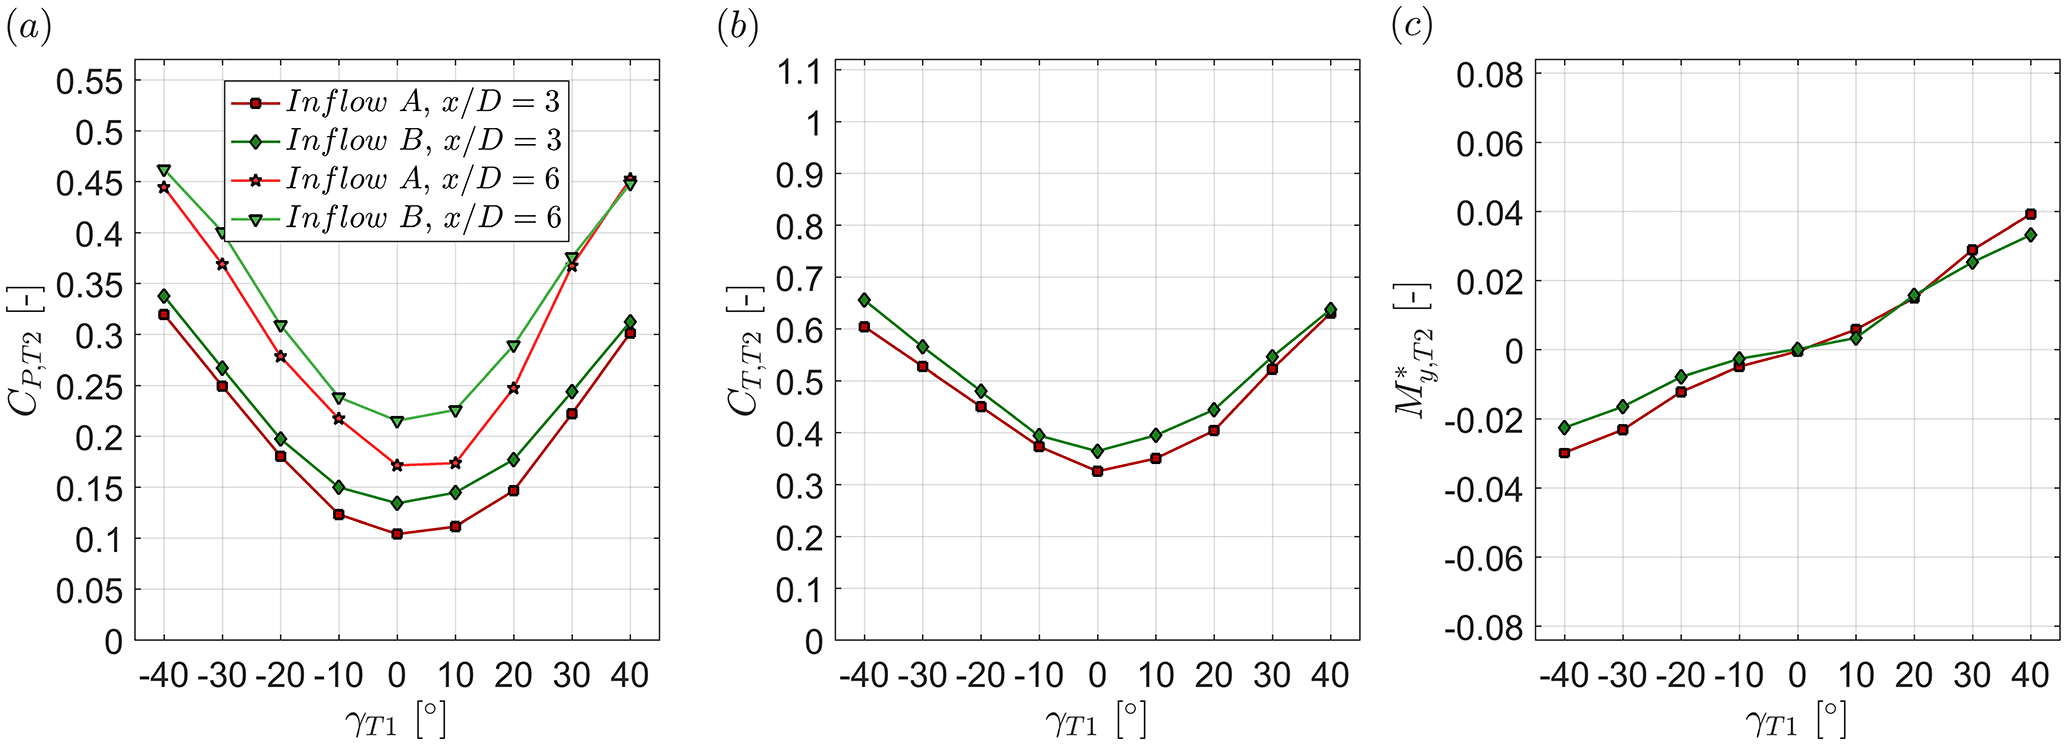
Figure 4Downstream turbine (a) power coefficient, (b) thrust coefficient and (c) normalized yaw moment as a function of the upstream turbine's yaw angle γT1. The downstream turbine T2 is located at and . The turbines are exposed to inflows A and B.
The downstream turbine's power coefficient CP,T2 is in general observed to be higher for a higher inflow turbulence (inflow B). As previously observed in Bartl et al. (2018), the wake flow recovers at a higher rate, leaving more kinetic energy for the downstream turbine to extract. The difference in T2's power extraction between the two inflow turbulence levels is observed to be highest at small upstream turbine yaw angles γT1. At high yaw angles , however, the power coefficient CP,T2 is very similar for the two different inflow turbulence levels. For these high yaw angles the wake's mean velocity deficit has the largest lateral deflection, exposing about half of T2's rotor-swept area to the freestream (Bartl et al., 2018). The kinetic energy content in the freestream is about the same for both inflows, which brings T2's power levels closer together. Moreover, the downstream turbine's power output at low inflow turbulence (inflow A) is observed to be more asymmetric with respect to γT1 than at high inflow turbulence (inflow B). Especially for , the downstream turbine power CP,T2 is strongly asymmetric for inflow A. This observation corresponds well to the asymmetry in the mean streamwise wake flow measured for positive and negative yaw angles reported in Bartl et al. (2018). Therein, the wake flow behind a positively and negatively yawed turbine exposed to inflow A was observed to feature a higher degree of asymmetry than for the same turbine exposed to inflow B. For extreme yaw angles , T2's power coefficient reaches levels of –0.46, which is about the same magnitude as CP,T1 at . These high downstream power coefficients CP,T2 can be explained by increased velocity levels of in the freestream outside of the wake as a result of wind tunnel blockage (Bartl et al., 2018). The downstream turbine power coefficient, however, still refers to the undisturbed far-upstream reference velocity uref. Although a considerable part of the downstream turbine rotor is impinged by T1's wake, higher wind speeds outside of the wake lift the downstream turbine's power to these levels.
Similar trends are observed for the downstream turbine thrust coefficient CP,T2 (Fig. 4b), where higher thrust forces are measured for the higher turbulence level in inflow B. Inflow A implicates a higher asymmetry in CT,T2 with respect to γT1. As previously discussed, the downstream turbine yaw moments are observed to increase with larger upstream turbine yaw angles γT1. For both inflow cases, the yaw moments' absolute values are seen to be higher for positive γT1 than for negative γT1. Larger yaw moments are measured for inflow A than for inflow B, which possibly stems from stronger mean velocity gradients in the wake flow in inflow A. The yaw moments on the downstream turbine located at have approximately the same magnitude as the yaw moments measured on the upstream turbine . Consequently, an intentional upstream turbine yaw misalignment implicates significant yaw moments on the upstream turbine itself as well as an aligned downstream turbine.
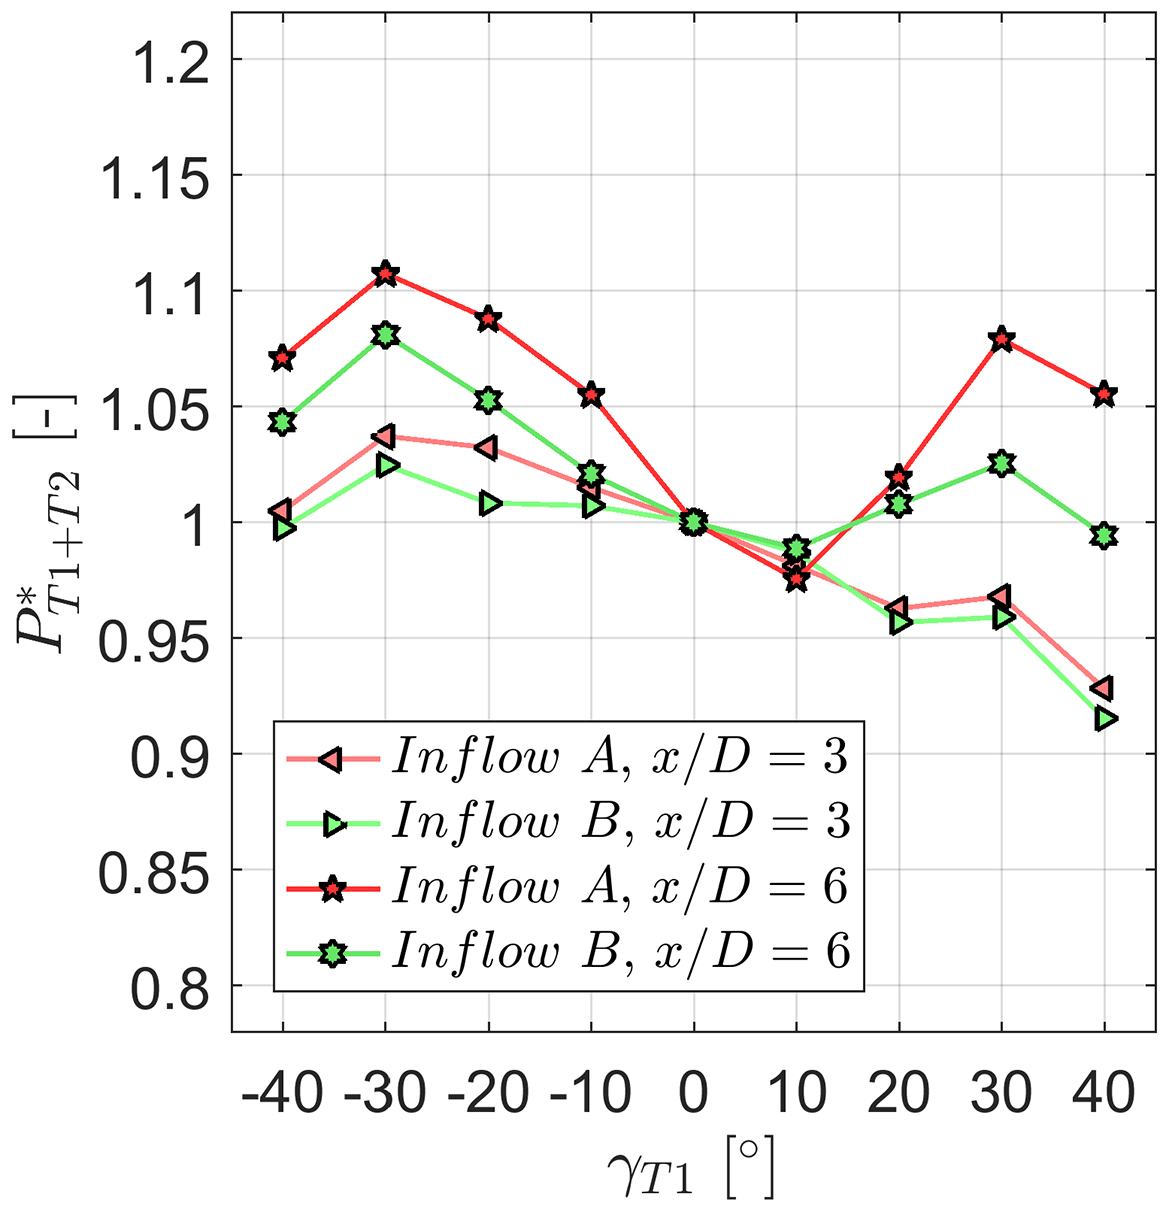
Figure 5Combined relative power of two turbines for different upstream turbine yaw angles γT1. The downstream turbine T2 is located at and . The turbines are exposed to inflows A and B.
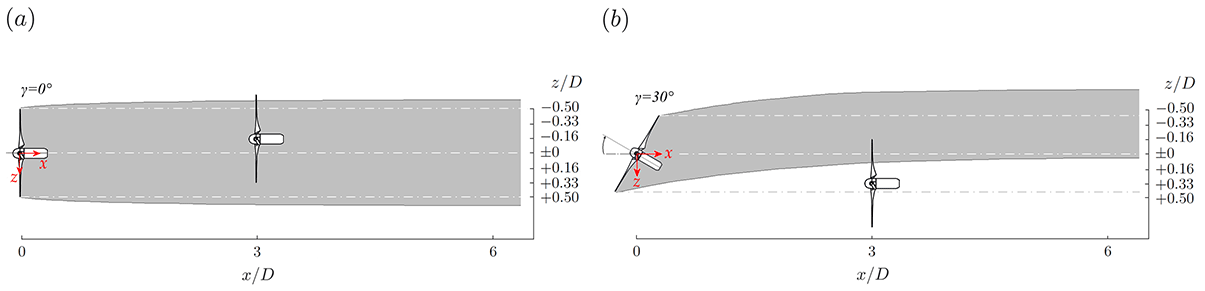
Figure 6Top view of two lateral offset positions ((a) and (b) ) of the downstream turbine while operated in the wake of an upstream turbine at . The upstream turbine is operated at (a) and (b) .
A main goal of this study is to find out if upstream turbine yawing can positively affect the total power output. As observed in Fig. 1 yawing the upstream turbine reduces its power output, while Fig. 4 shows that the downstream turbine's power increases simultaneously. In order to quantify if the gain in T2 power can make up for the losses in T1, we define the combined relative power output of the two-turbine array:
The results for the combined relative power are presented in Fig. 5 for both inflow conditions and two turbine separation distances. In all of these four setups a maximum increase in combined power between 3.5 % and 11 % was measured for upstream turbine yawing. For both turbine spacings, the maximum combined efficiencies were measured for . The combination of a larger wake deflection and a progressed wake recovery at higher separation distances is seen to shift the optimum of the energy balance between T1 and T2 to higher yaw angles γT1. Moreover, the combined relative power is seen to be asymmetric with higher values for negative yaw angles γT1. Both upstream turbine power CP,T1 and downstream turbine power CP,T2 are observed to be asymmetrically distributed. The larger portion can, however, be ascribed to the power extraction of downstream turbine, which is exposed to asymmetric wake flow fields for positive and negative yaw angles. Furthermore, the relative power gains are observed to be significantly larger for lower inflow turbulence levels (inflow A). Relative power gains of about 11 % were measured for inflow A, while only 8 % were obtained for inflow B at the same yaw angle of . Asymmetries in the combined power output have been previously observed in a computational study by Gebraad et al. (2016) and a similar experimental setup by Schottler et al. (2016). In a recent follow-up study, Schottler et al. (2017) attributed the asymmetry to a strong shear in the inflow to the two-turbine setup. As the inflow in the present study was measured to be spatially uniform, inflow shear is not a reason for the observed asymmetries.
3.3 Test case 2: offset turbines
The power and loads of the downstream turbine T2 are dependent on many different parameters, such as the inflow conditions, the operating point of the upstream turbine T1, its relative streamwise and lateral position with respect to T1, and its operating point. In the second test case we therefore investigate the downstream turbine's performance in lateral offset. That means that T2 experiences partial-wake situations. The turbine separation distance is in this test case fixed to , while different offset positions are investigated. This is done for inflow B (TIB=10.0 %) only, while upstream turbine yaw angles of and are investigated. In Fig. 6 two example positions of the downstream turbine are sketched, illustrating two different wake impingement situations.
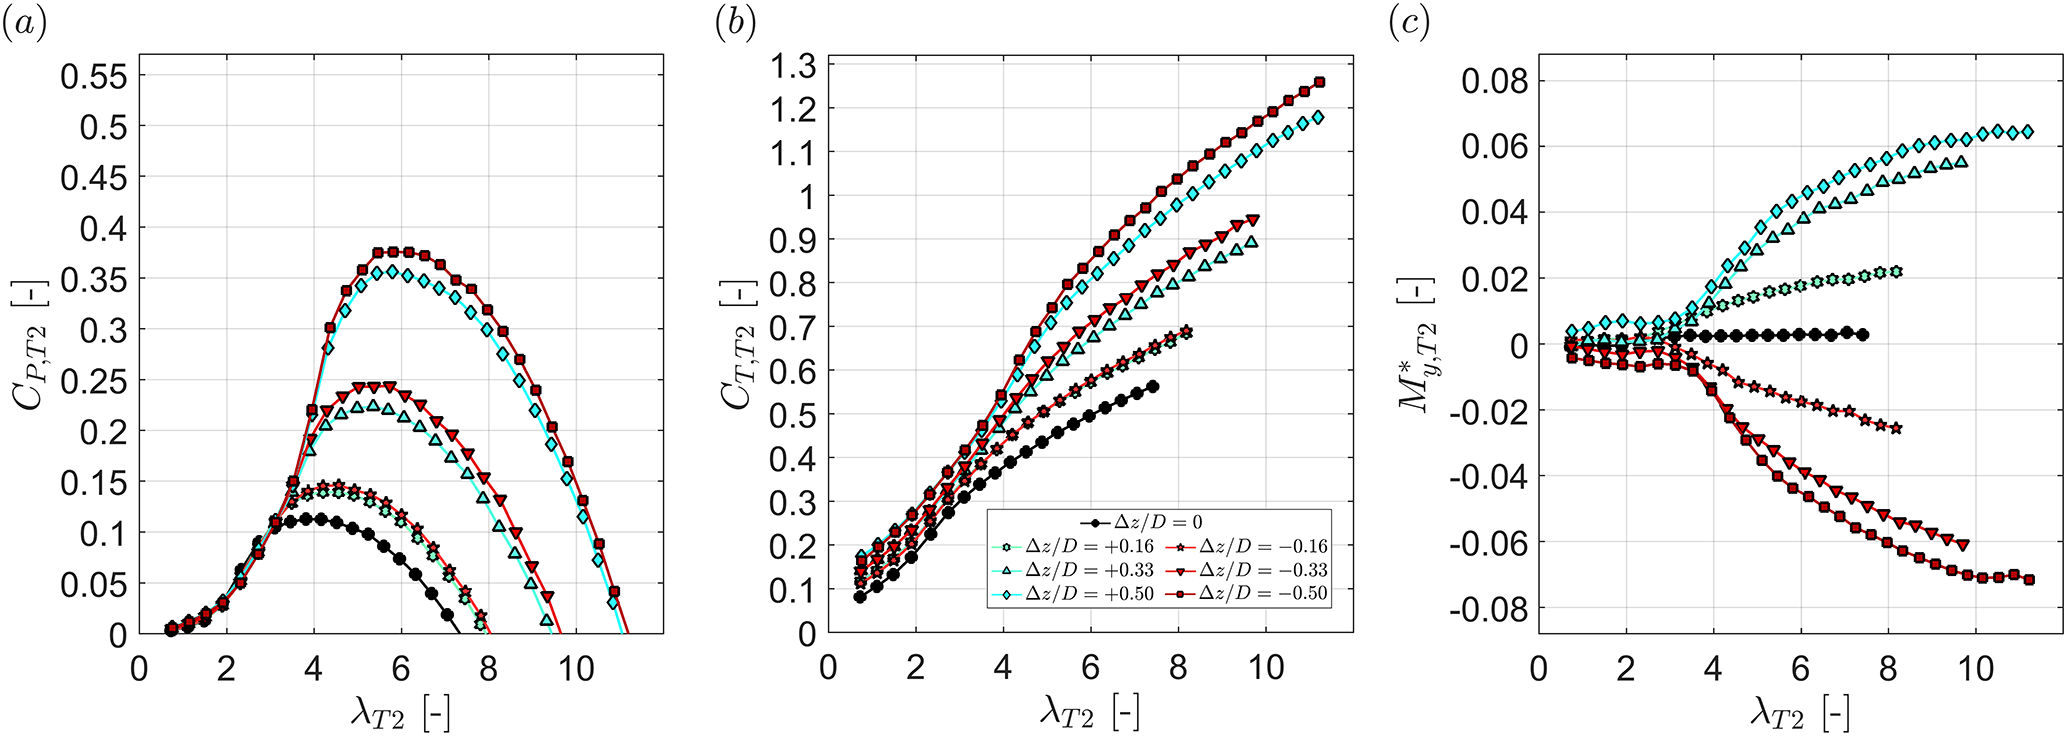
Figure 7Downstream turbine (a) power coefficient, (b) thrust coefficient and (c) normalized yaw moment as a function of its tip speed ratio λT2 for different lateral offset positions Δz∕D. The upstream turbine yaw angle is kept constant at . The downstream turbine T2 is located at . The turbines are exposed to inflow B.
Figure 7 shows the downstream turbine's CP,T2, CT,T2 and while operated in the wake of the upstream turbine at dependent upon its tip speed ratio λT2 and lateral offset position Δz∕D. As expected, the power coefficient is seen to increase with increasing lateral offset Δz∕D as the downstream turbine is partly exposed to a flow of higher kinetic energy. T2's power coefficient is observed not to be entirely symmetric with respect to its lateral position in the wake. Slightly higher power coefficients are measured for negative offset positions. The reason for this is deemed to be a not perfectly axis-symmetric velocity deficit at as indicated in Bartl et al. (2018). An analysis of the available kinetic energy contained in the wake at behind a non-yawed upstream turbine confirmed a higher kinetic energy over an imaginary rotor-swept area for negative lateral offsets z∕D than for positive offsets. As observed earlier, T2's optimum operating point shifts to higher tip speed ratios λT2 with increasing kinetic energy being available in the wake.
Similar trends are observed for the downstream turbine thrust coefficient CT,T2, which was measured to be slightly higher for negative offset positions. The yaw moments experienced by the downstream turbine are seen to increase for larger lateral offsets as the rotor is impinged by stronger mean velocity gradients. The largest increases are detected for a change from to ±0.16 and from ±0.16 to ±0.33, while a position change from ±0.33 to ±0.50 only causes a small increase in yaw moment. The curves are generally observed to be almost symmetric with respect to the offset position but also show slightly higher absolute values for negative offset positions.
The effect of a variation in upstream turbine yaw angle from to on the downstream turbine's characteristics in different lateral offset positions is presented in Fig. 8. For the shown results the downstream turbine T2 is operated at its optimum λT2, which differs for each offset position.
The red curves summarize the results for already shown in Fig. 7 for their optimum operating point, while the blue curves represent a setup in which T1 is operated at (see Fig. 6). For this upstream turbine yaw angle, the wake center is shifted to (Bartl et al., 2018), and correspondingly the blue curves minima in CP,T2 and CT,T2 are shifted to (Fig. 8a and b). The yaw moment as depicted in Fig. 8c is observed to be around zero for this offset position, as the rotor is approximately impinged by a full wake. For an offset position around to the yaw moments reach a maximum level, as roughly half the rotor-swept area is impinged by the low-velocity region of the wake. At a lateral offset of the yaw moments on T2 are observed to decrease again. A large part of the rotor is exposed to the freestream flow; however, the wake is not yet entirely deflected away from T2. For this offset position the power and thrust coefficient are seen to reach very high levels as the rotor is exposed to a large portion of high-kinetic-energy freestream flow. A power coefficient of can be explained by increased freestream velocity levels of (Bartl et al., 2018) caused by wind tunnel blockage. The power and thrust coefficient still refer to uref measured upstream of T1. Unfortunately, it is not possible to correct for blockage effects on the downstream turbine power, thrust and yaw moments with simple correction models. The influence of wind tunnel blockage on the highly complex inflow to the downstream turbine operated in a partial wake would have to be quantified by dedicated experiments or high-fidelity simulations.
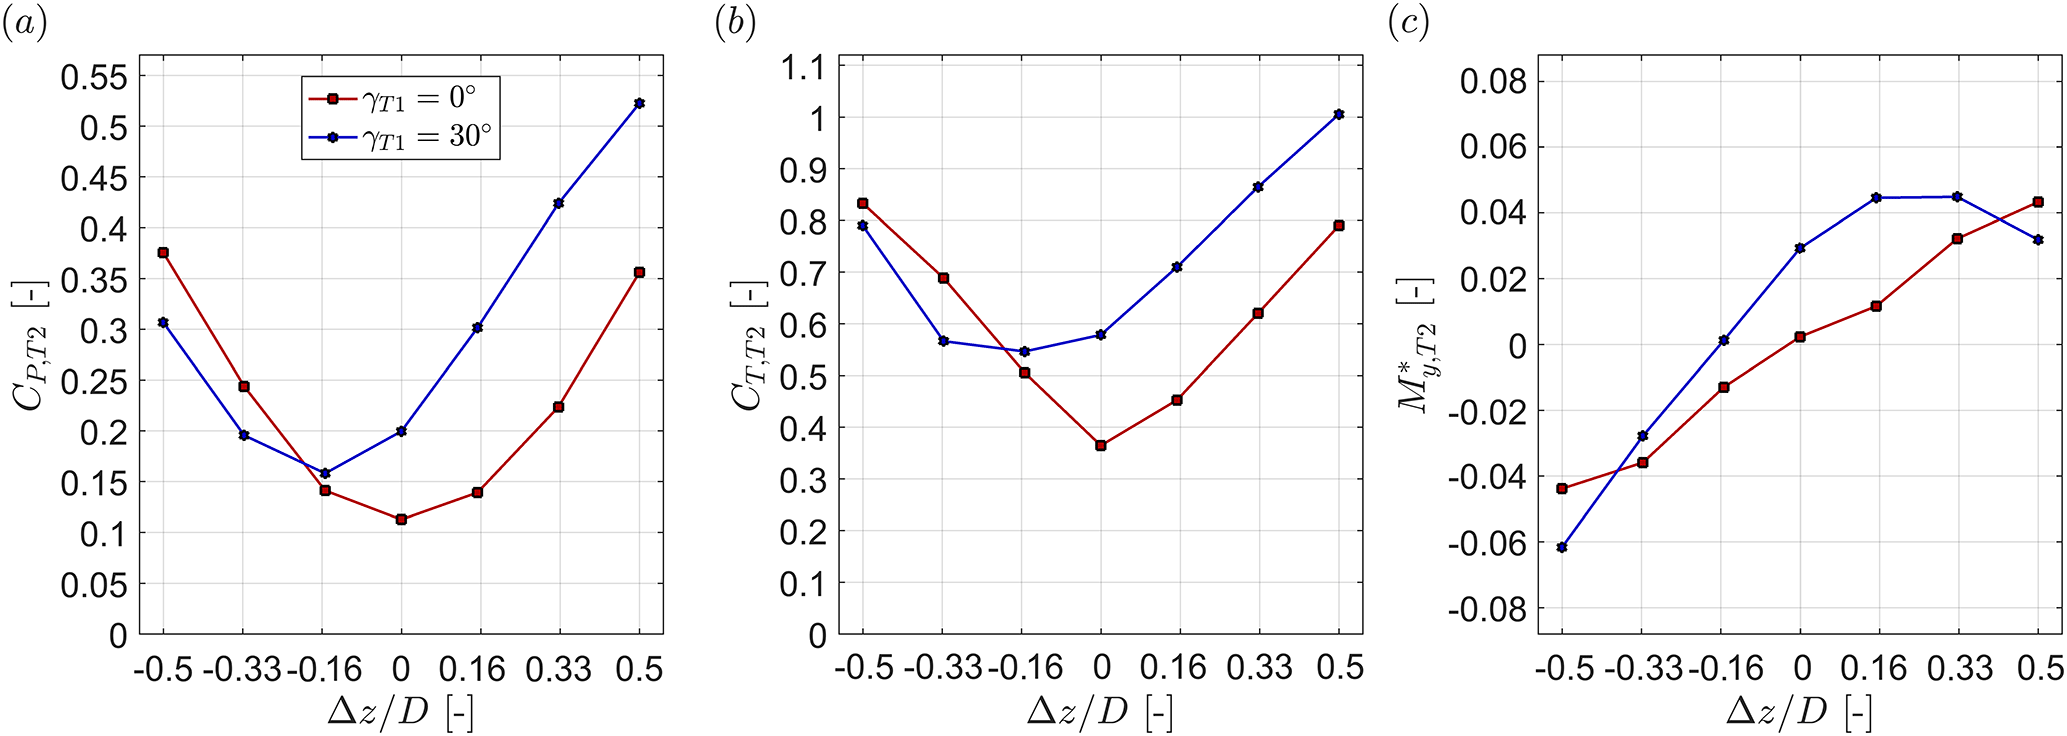
Figure 8Downstream turbine (a) power coefficient, (b) thrust coefficient and (c) normalized yaw moment as a function of its lateral offset position Δz∕D. The downstream turbine yaw angle is kept constant at . The downstream turbine T2 is located at . The turbines are exposed to inflow B.
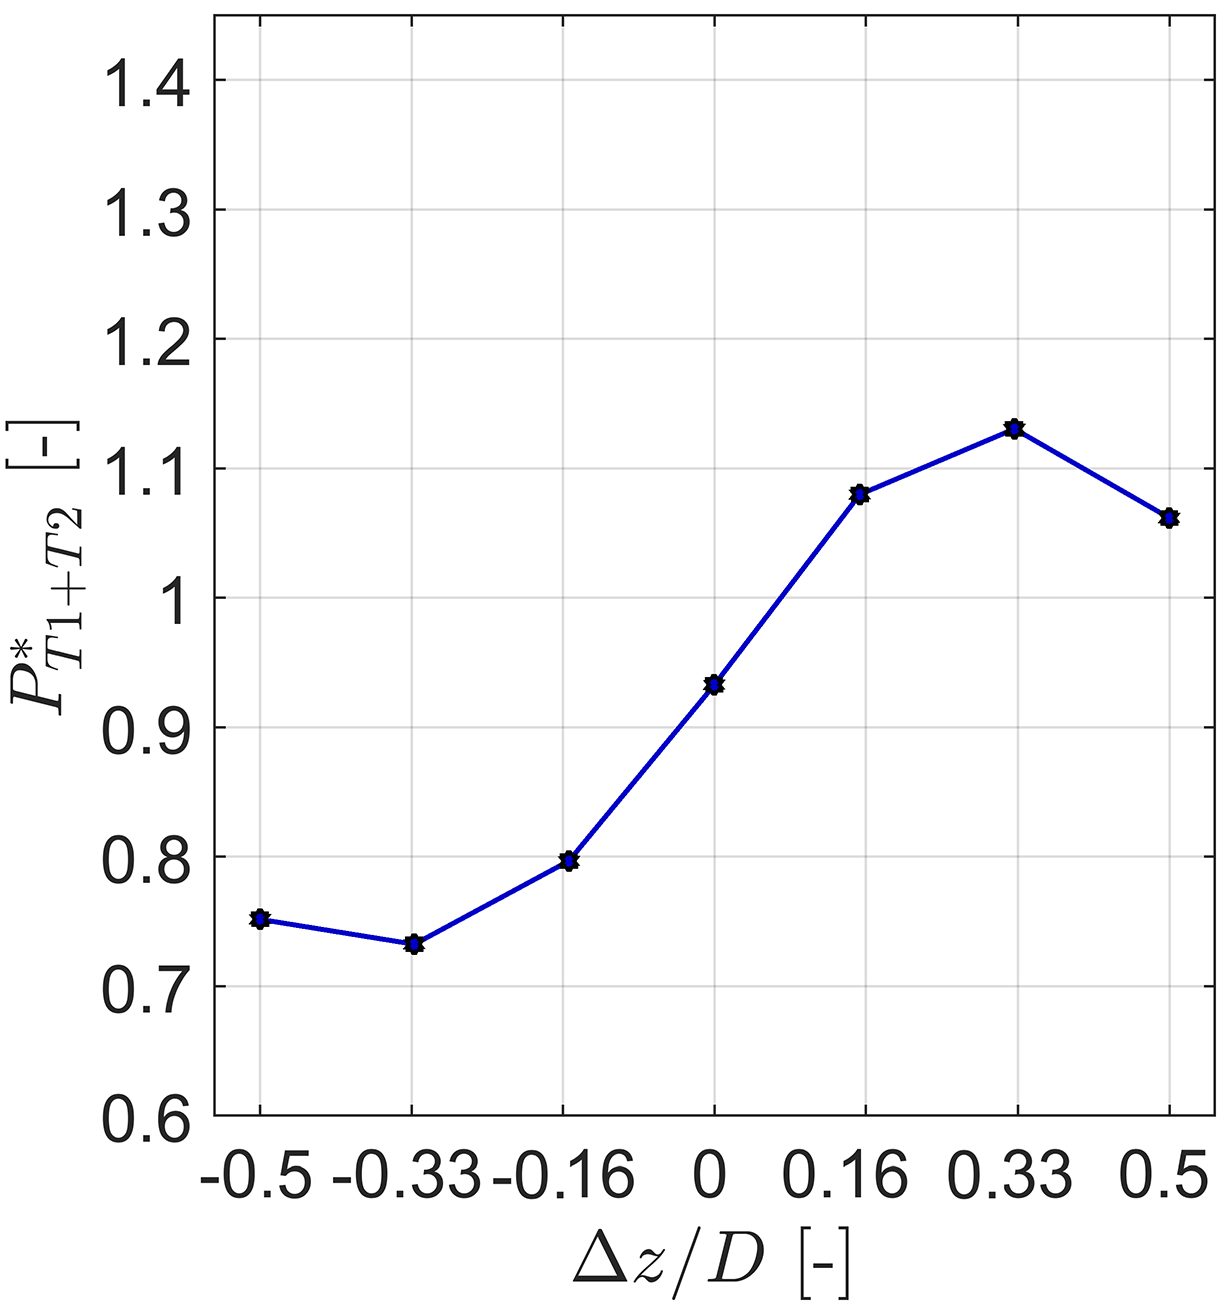
Figure 9Combined relative power of the two-turbine array for different lateral offset positions Δz∕D. The combined power is calculated for a change of upstream turbine yaw angle from γT1=0 to for each position. The downstream turbine T2 is located at . The turbines are exposed to inflow B.
The combined relative power output of the two-turbine array is in this case calculated for a change of upstream turbine yaw angle from γT1=0 to . It has to be kept in mind that the upstream turbine power is constant, independent of the downstream turbine position. The combined power for each offset position is calculated as
Figure 9 shows the resultant combined relative power output. For an offset position of a maximum combined power increase of 13 % is measured, as a major part is deflected away from the downstream rotor. Surprisingly, the relative power gains measured for an offset are measured to be smaller, amounting to about 6 %. This can be explained by significantly larger CP,T2 values in the non-yawed case for than for , allowing smaller relative gains. For zero lateral offset, about 5 % in combined power is lost when yawing T1 to as previously observed in Fig. 5. In the case of the downstream turbine being located at negative offset positions Δz∕D, the wake is deflected directly on T2's rotor, significantly reducing its power output and consequently also the combined power.
In conclusion, it has been demonstrated that intentional upstream turbine yaw control is favorable in offset situations when considering both the power output and yaw moments on a downstream turbine. Depending on the downstream turbine's streamwise and lateral position, the wake can be partly or even fully deflected away from its rotor-swept area. This finding experimentally confirms results of a similar test case recently computed with a model framework by van Dijk et al. (2017).
3.4 Test case 3: downstream turbine yawing
The third and final test case investigates whether a variation in downstream turbine yaw angle γT2 contributes to a yaw load mitigation and power optimization. As previously seen, both partial wake impingement and turbine yaw misalignment are possible sources for increased yaw moments. An intentional yaw misalignment opposed to the partial wake impingement is therefore considered to cancel out yaw loading on the turbine. For this purpose, the downstream turbine yaw angle is systematically varied from to in steps of 5∘ for all seven lateral offset positions and upstream turbine yaw angles . A sketch of two downstream turbine yaw angles at two offset positions is presented in Fig. 10.
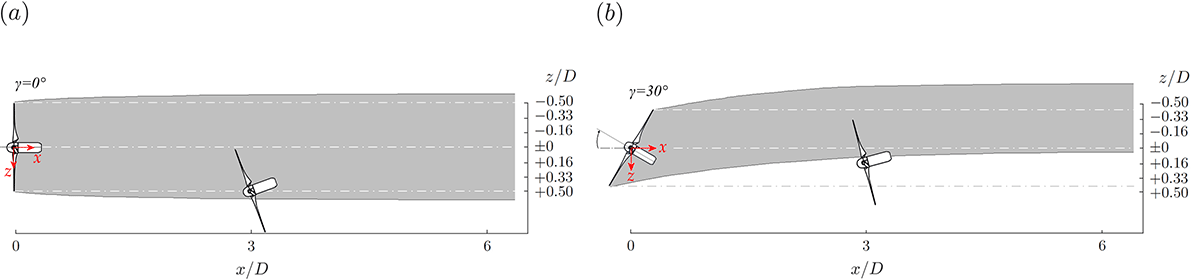
Figure 10(a) Top view of the downstream turbine T2 operated at a lateral offset position and a yaw angle of in the wake of an upstream turbine T1 operated at . (b) Top view of the downstream turbine T2 operated at a lateral offset position () and a yaw angle of in the wake of an upstream turbine T1 operated at .
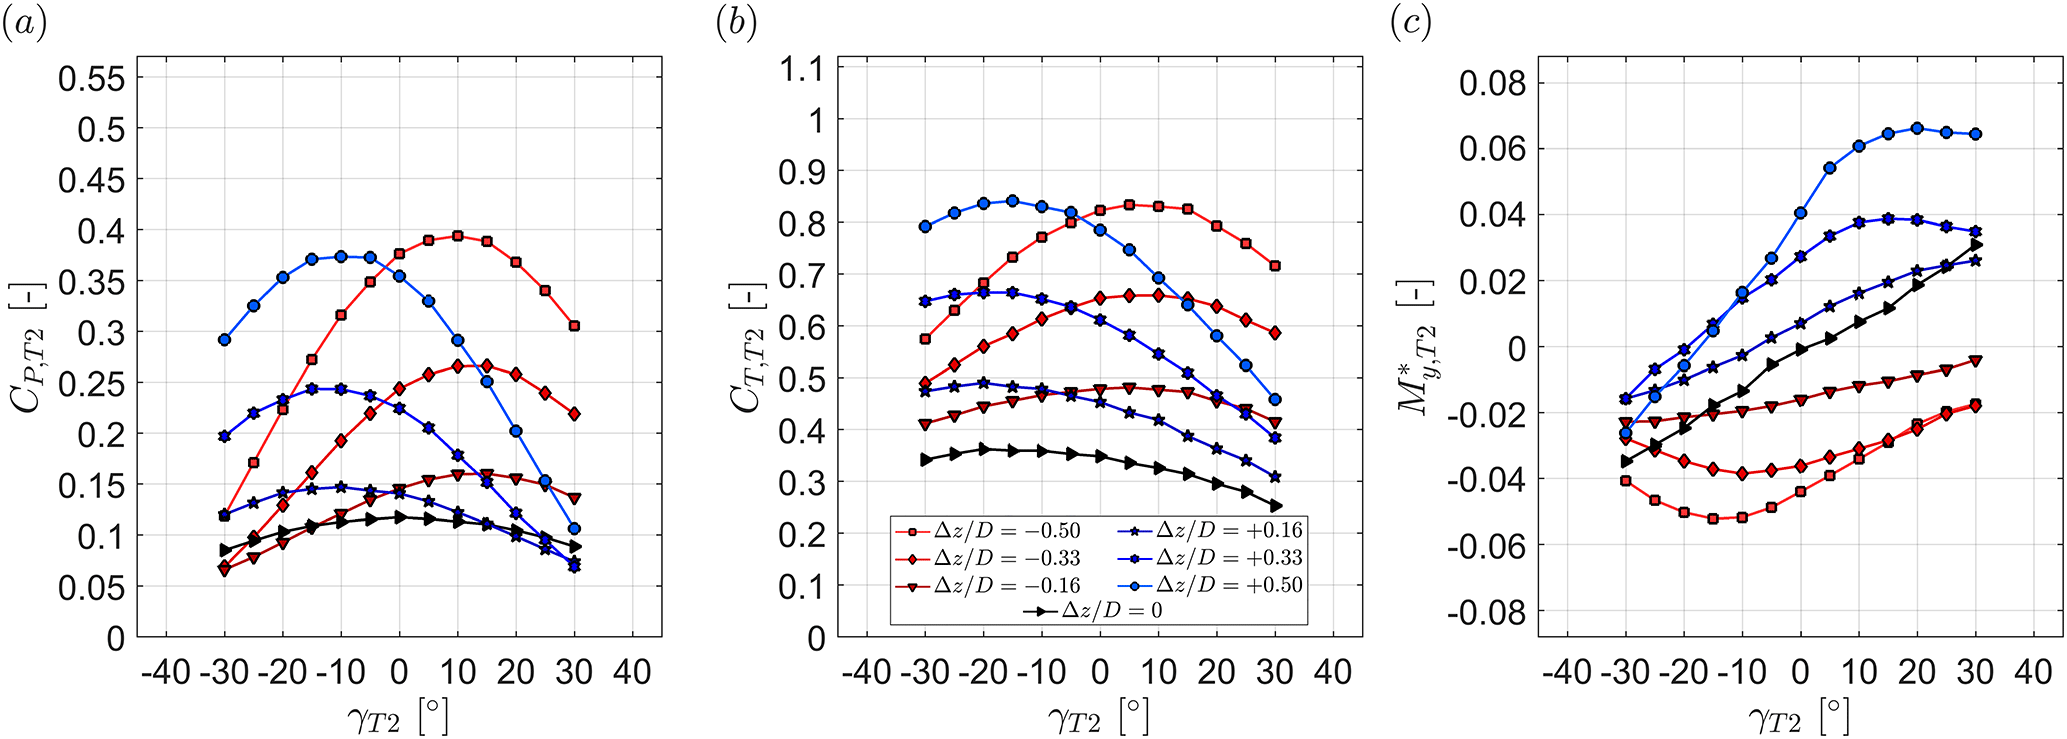
Figure 11Downstream turbine (a) power coefficient, (b) thrust coefficient and (c) normalized yaw moment as a function of its yaw angle γT2 for different lateral offset positions Δz∕D. The upstream turbine yaw angle is kept constant at . The downstream turbine T2 is located at . The turbines are exposed to inflow B.
The resulting CP,T2, CT,T2 and of the downstream turbine dependent upon its yaw angle γT2 and lateral offset position Δz∕D for a constant upstream turbine yaw angle of are shown in Fig. 11. The points for correspond to the previously shown red lines in Fig. 8. If the downstream turbine rotor is fully impinged by the upstream turbine's wake, i.e., , a variation of its yaw angle γT2 reduces its power output and increases uneven yaw moments. During a lateral offset, however, the maximum power output and minimum yaw moments are found for yaw angles . At a lateral offset position of , for instance, the maximum CP,T2 is assessed for . Simultaneously, the yaw moment is measured to be around zero at this yaw angle. The potential of load reductions of a single turbine by yawing has been previously discussed by Kragh and Hansen (2014), in situations where the rotor was exposed to vertically sheared inflows. In the present test case, however, the partial wake impingement on the rotor represents a situation of a strongly horizontally sheared flow. Whether the shear in the incoming wind field is horizontal or vertical obviously makes a big difference, but mitigation of loads and maximization of power might be possible with yaw adjustments in both cases. As the downstream turbine operated in the partial wake is exposed to a strongly sheared inflow, yaw moments can be mitigated by actively yawing the rotor in the opposite direction to the incoming shear. The simultaneous power increase for the oppositely yawed downstream rotor is a positive side effect, although the exact reasons for the power increase are not entirely clear at this stage. A power increase by downstream turbine yawing has previously been reported in a full-scale data evaluation by McKay et al. (2013), who found an offset in the downstream turbine's yaw alignment for the purpose of optimized power output when operated in a partial wake of an upstream turbine. The downstream turbine yaw angle was observed to adjust itself opposed to the velocity gradient in the partial wake impinging the downstream rotor. These findings are in total agreement with the optimal downstream turbine yaw angle measured in our wind tunnel experiment. Higher power outputs and decreased yaw moments are also measured for moderate yaw angles around at larger lateral offsets of and . The slope of the power curves in Fig. 11a and yaw moment curves in Fig. 11c are observed to be even steeper for larger lateral offsets. The power gains when yawing the turbine from to are larger for higher lateral offsets. At the same time, the relative yaw moment reduction is larger, implying that yawing of the downstream turbine in the opposite direction is expected to be even more effective for higher lateral offsets.
For negative lateral offset positions, the opposite trends are observed; i.e., maximum power and smallest absolute yaw moments are measured for positive downstream turbine yaw angles γT2. The power output and yaw moment distribution, however, are not completely symmetrical with respect to yaw angle γT2 and offset position Δz∕D.
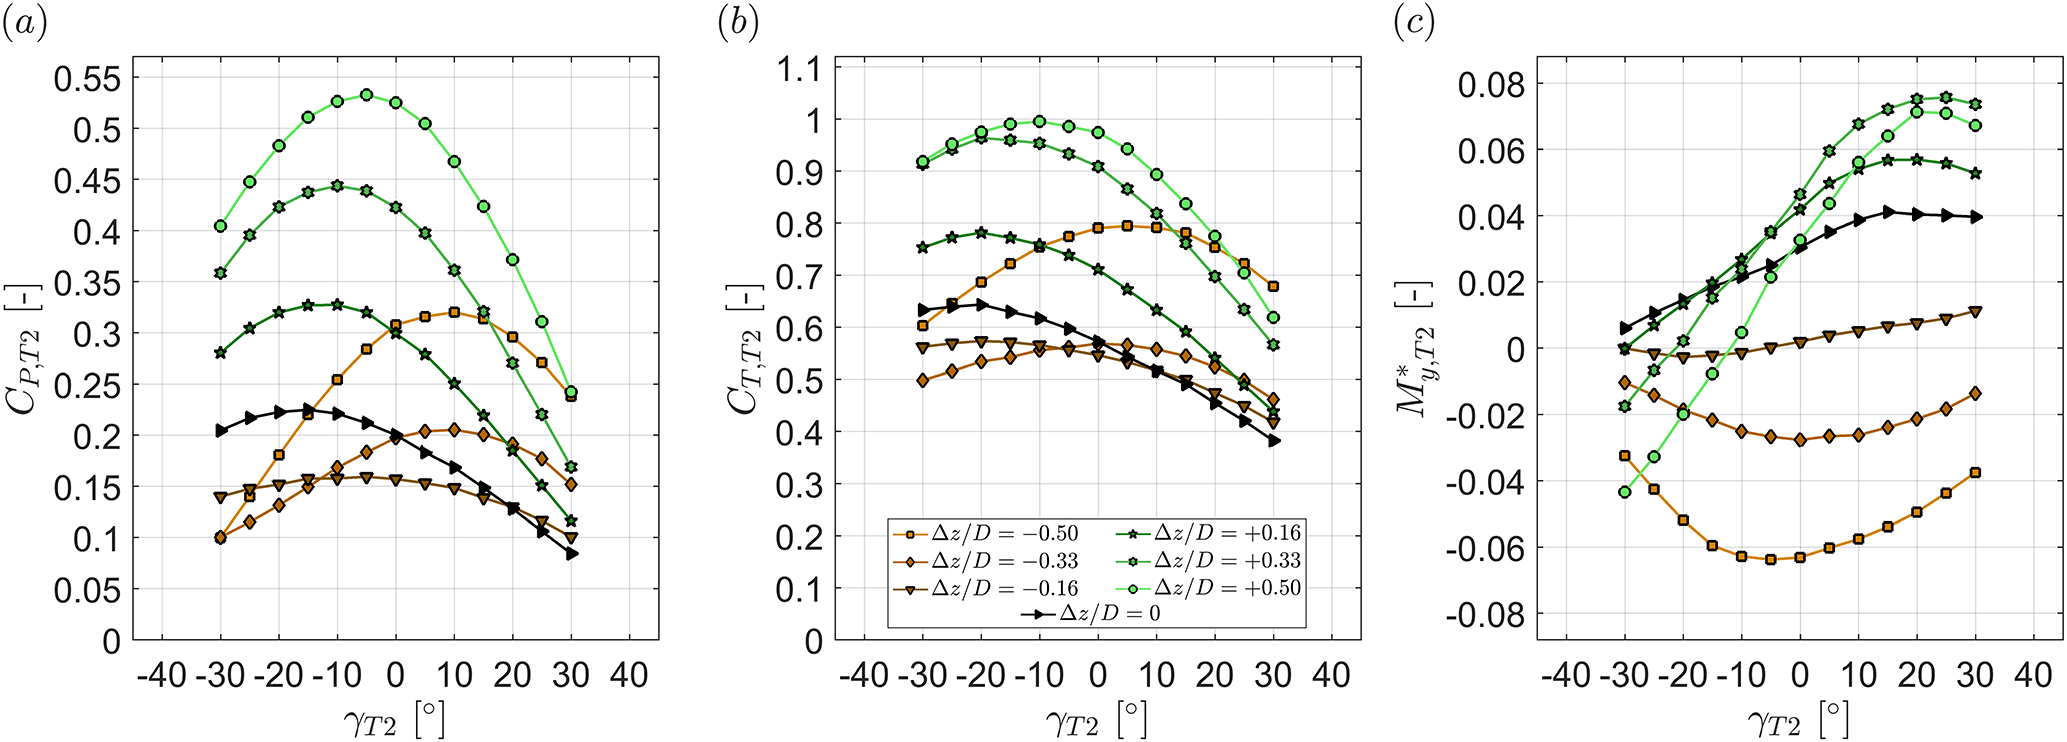
Figure 12Downstream turbine (a) power coefficient, (b) thrust coefficient and (c) normalized yaw moment as a function of its yaw angle γT2 for different lateral offset position Δz∕D. The upstream turbine yaw angle is kept constant at . The downstream turbine T2 is located at . The turbines are exposed to inflow B.
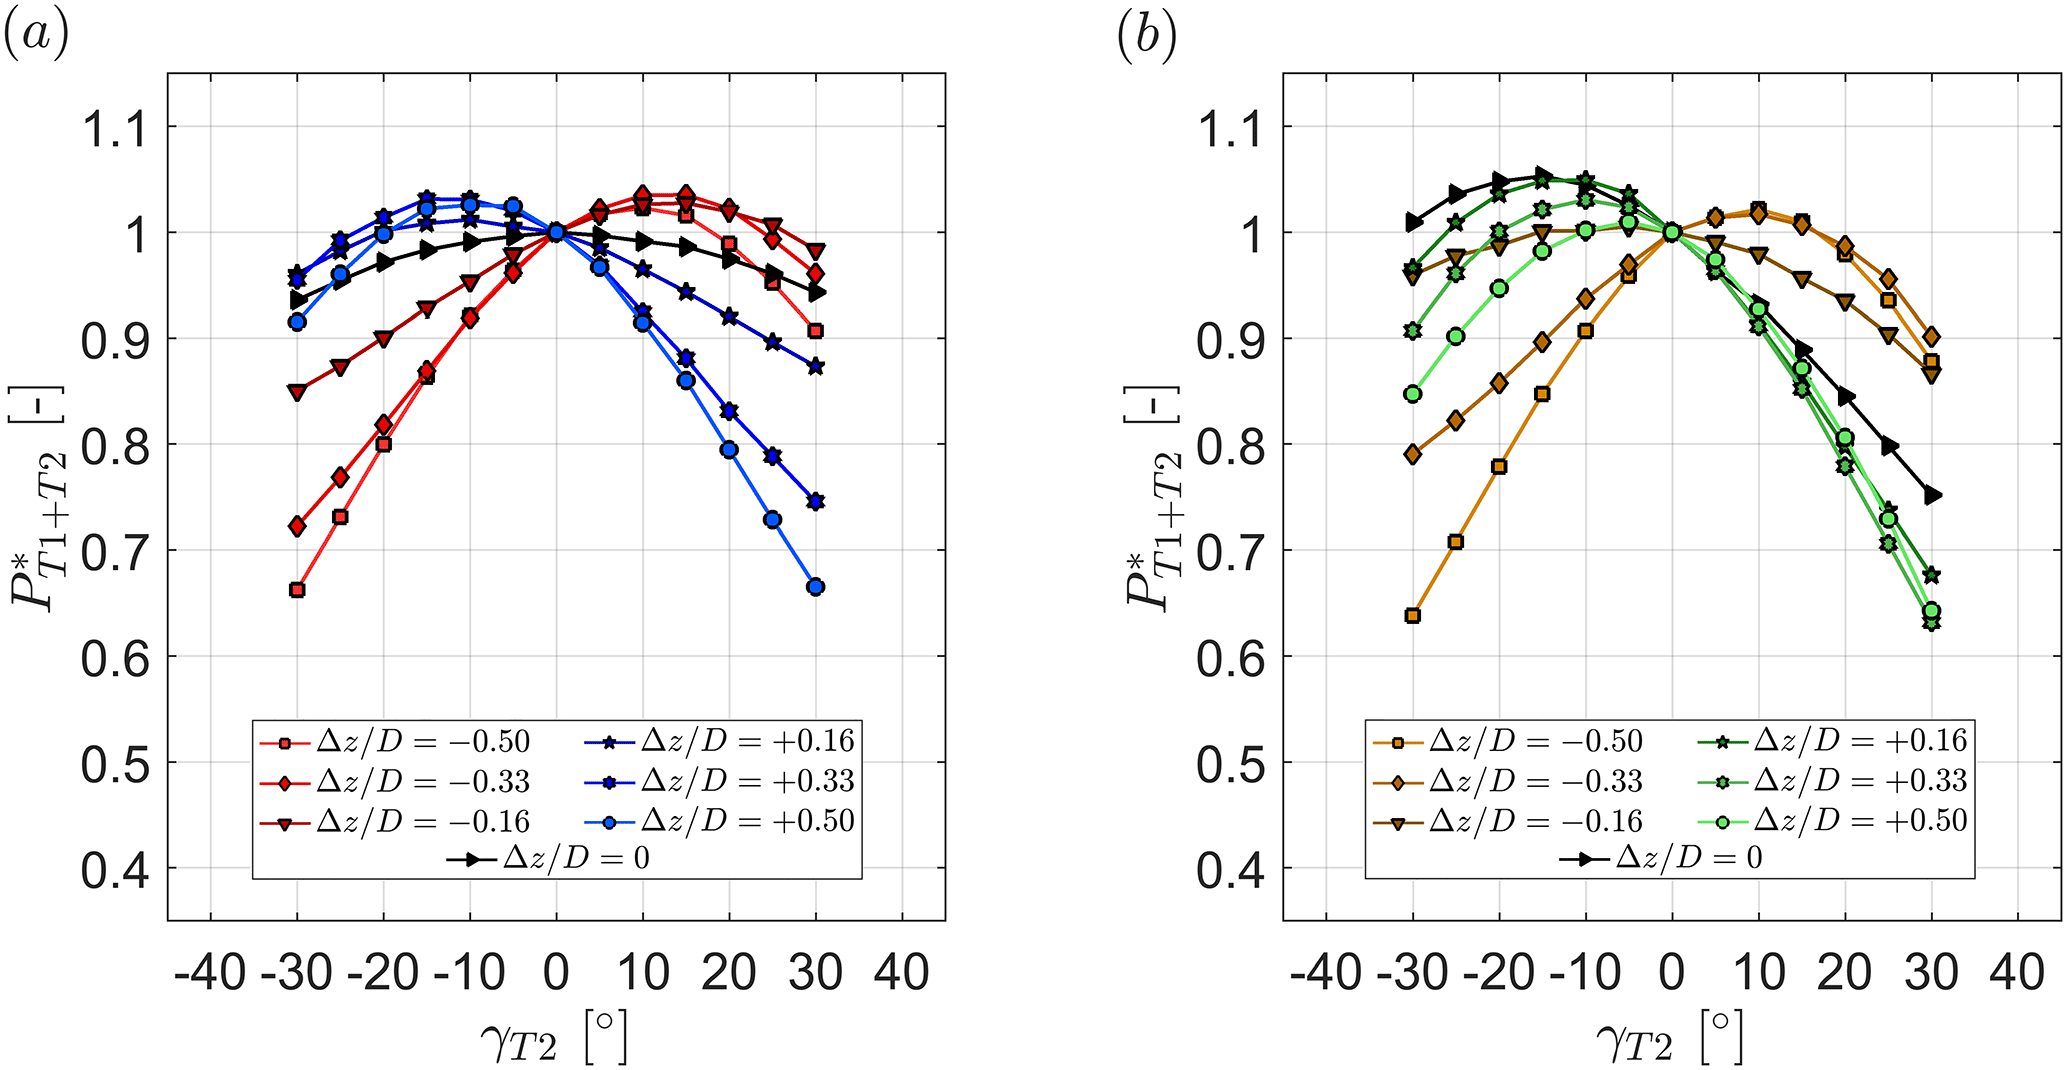
Figure 13Combined relative power of two turbines as a function of the downstream turbine yaw angle γT2 for different lateral offset positions Δz∕D. The upstream turbine yaw angle is kept constant at (a) and (b) . The downstream turbine T2 is located at . The turbines are exposed to inflow B.
The concept of downstream turbine yawing in partial-wake-impingement situations is moreover investigated for an upstream turbine yaw angle of . The wake flow features a significantly higher asymmetry in this case. The results for CP,T2, CT,T2 and are shown in Fig. 12. As previously observed, an offset of approximately corresponds to an impingement of the full wake. Thus, the power coefficient has an almost symmetric distribution with respect to downstream turbine yaw angle γT2. The yaw moments are observed to be rather low for this offset position and around zero for γT2=0. For partial-wake-impingement situations at , negative downstream turbine yaw angles are again seen to reduce the yaw moments acting on the rotor. The gradients in yaw moment reduction per degree of yaw angle are observed to be steeper for larger lateral offsets. The maximum power coefficients are again measured for moderate downstream turbine yaw angles around .
Power gains by downstream turbine yawing are assessed by a relative combined power of the two-turbine array:
As a reference of the power measured for the non-yawed upstream turbine, a non-yawed downstream turbine in an aligned setup () is used. The results are shown in Fig. 13. For an upstream turbine yaw angle of (Fig. 13a) combined power gains of approximately 3 % are measured for moderate downstream turbine yaw angles (γT2±10 to ). The combined power characteristics are observed to be quite symmetrical with respect to downstream turbine offset and its yaw angle. Slightly higher relative power gains are obtained for the case of an upstream turbine yaw angle of (Fig. 13b). A maximum power gain of about 5 % is measured for offset positions and +0.16, and a downstream turbine yaw angle between and . Note that the downstream turbine's tip speed ratio λT2 is kept constant when the downstream turbine is yawed. As no change in optimum tip speed ratio was measured for yaw angle variations up to in undisturbed inflow, it is assumed at this stage that no further adjustments of the tip speed ratio in a partial wake are needed for an optimal downstream turbine power output.
In conclusion, this third test case demonstrates that moderate downstream turbine yawing can be an effective method of mitigating yaw moments acting on the rotor in partial-wake situations, while simultaneously obtaining slight power gains.
A wind tunnel experiment studying the effects of intentional yaw misalignment on the power production and yaw moments of a downstream turbine was presented. Both full wake impingement and partial wake overlap were investigated. For partial wake overlap, the concept of downstream turbine yawing for the purpose of yaw moment mitigation is examined.
It is demonstrated that upstream turbine yaw misalignment is able to increase the combined power production of the two turbines for both partial and full wake overlap setups. For aligned turbines the combined array power was increased up to a maximum of 11 % for a separation distance of and low inflow turbulence levels (TIA=0.23 %). At a higher inflow turbulence of TIB=10.0 %, however, the relative power increase was assessed to be only 8 %. For smaller turbine separation distances, combined power gains were assessed to be even smaller. The distribution of combined power gains dependent upon the upstream turbine yaw angle was observed to be rather asymmetrical. The formation of not entirely symmetric velocity deficit shapes in the wake was deemed to be the main reason for that finding.
The obtained power gains were assessed to be at the cost of increased yaw moments on the upstream rotor. The yaw moments on the upstream rotor are observed to increase roughly linearly with increasing yaw angle but are not entirely symmetrical distributed. Upstream turbine yaw control is moreover seen to directly influence the yaw moments on a downstream rotor. For aligned turbine positions, the downstream turbine yaw moments are observed to increase to magnitudes similar to those for the upstream turbine. These results highlight the importance of also taking loads into account when optimizing layout and control of a wind farm.
Further, we demonstrate advantages of upstream turbine yaw control for load reduction and power increases on an offset downstream turbine. For situations in which the downstream turbine is impinged by a partial wake, upstream turbine yaw control can redirect the wake either on or away from the downstream rotor. If the wake is directed onto the downstream turbine's rotor-swept area, its yaw moments and power production reduce. If the lateral offset between the turbines is large enough, the wake can be deflected entirely away from the downstream turbine, maximizing its power and canceling out yaw moments.
Moreover, a final test case proved the concept of yaw control for yaw moment mitigation on a downstream turbine operated in partial wake overlap. While yaw moments are observed to decrease when yawing the rotor opposed to the shear layer in the incoming wake flow, the turbine's power output is also seen to increase. These results illustrate the importance for combined power and load optimization on all turbines in a wind farm.
The experimental dataset is available on request to the corresponding author.
The experiments were prepared and executed by JB and FM under supervision of LS. The paper was written by JB and revised by FM and LS.
The authors declare that they have no conflict of interest.
A special thank-you to Jannik Schottler for lots of discussions on the topic and for
proofreading the manuscript.
Edited by: Raúl Bayoán Cal
Reviewed by: three anonymous referees
Adaramola, M. and Krogstad, P.-Å.: Experimental investigation of wake effects on wind turbine performance, Renew. Energ., 36, 2078–2086, https://doi.org/10.1016/j.renene.2011.01.024, 2011. a
Andersen, S., Sørensen, J., and Mikkelsen, R.: Performance and Equivalent Loads of Wind Turbines in Large Wind Farms, J. Phys. Conf. Ser., 854, 012001, https://doi.org/10.1088/1742-6596/854/1/012001, 2017. a
Annoni, J., Gebraad, P., Scholbrock, A., Fleming, P., and van Wingerden, J.: Analysis of axial-induction-based wind plant control using an engineering and a high-order wind plant model, Wind Energy, 19, 1135–1150, https://doi.org/10.1002/we.1891, 2016. a
Bartl, J. and Sætran, L.: Experimental testing of axial induction based control strategies for wake control and wind farm optimization, J. Phys. Conf. Ser., 753, 032035, https://doi.org/10.1088/1742-6596/753/3/032035, 2016. a, b
Bartl, J. and Sætran, L.: Blind test comparison of the performance and wake flow between two in-line wind turbines exposed to different turbulent inflow conditions, Wind Energ. Sci., 2, 55–76, https://doi.org/10.5194/wes-2-55-2017, 2017. a, b
Bartl, J., Mühle, F., Schottler, J., Sætran, L., Peinke, J., Adaramola, M., and Hölling, M.: Wind tunnel experiments on wind turbine wakes in yaw: effects of inflow turbulence and shear, Wind Energ. Sci., 3, 329–343, https://doi.org/10.5194/wes-3-329-2018, 2018. a, b, c, d, e, f, g, h, i, j, k, l, m, n, o, p
Bastankhah, M. and Porté-Agel, F.: Experimental and theoretical study of wind turbine wakes in yawed conditions, J. Fluid Mech., 806, 506–541, https://doi.org/10.1017/jfm.2016.595, 2016. a
Bastankhah, M. and Porté-Agel, F.: Wind tunnel study of the wind turbine interaction with a boundary-layer flow: Upwind region, turbine performance, and wake region, Phys. Fluids, 29, 65105, https://doi.org/10.1063/1.4984078, 2017. a
Campagnolo, F., Petrović, V., Bottasso, C., and Croce, A.: Wind Tunnel Testing of Wake Control Strategies, Amer. Contr. Conf., ACC Boston, 2016, 513–518, https://doi.org/10.1109/ACC.2016.7524965, 2016. a
Damiani, R., Dana, S., Annoni, J., Fleming, P., Roadman, J., van Dam, J., and Dykes, K.: Assessment of wind turbine component loads under yaw-offset conditions, Wind Energ. Sci., 3, 173–189, https://doi.org/10.5194/wes-3-173-2018, 2018. a, b
Fleming, P., Gebraad, P., Lee, S., van Wingerden, J.-W., Johnson, K., Churchfield, M., Michalakes, J., Spalart, P., and Moriarty, P.: Evaluating techniques for redirecting turbine wakes using SOWFA, Renew. Energ., 70, 211–218, https://doi.org/10.1016/j.renene.2014.02.015, 2014. a
Fleming, P., Gebraad, P. M., Lee, S., van Wingerden, J.-W., Johnson, K., Churchfield, M., Michalakes, J., Spalart, P., and Moriarty, P.: Simulation comparison of wake mitigation control strategies for a two-turbine case, Wind Energy, 18, 2135–2143, https://doi.org/10.1002/we.1810, 2015. a, b
Gebraad, P. M. O., Fleming, P. A., and van Wingerden, J. W.: Comparison of Actuation Methods for Wake Control in Wind Plants, Amer. Contr. Conf., ACC Chicago, 2015, 1695–1701, https://doi.org/10.1109/ACC.2015.7170977, 2015. a
Gebraad, P. M. O., Teeuwisse, F. W., van Wingerden, J. W., Fleming, P. A., Ruben, S. D., Marden, J. R., and Pao, L. Y.: Wind plant power optimization through yaw control using a parametric model for wake effects-a CFD simulation study, Wind Energy, 19, 95–114, https://doi.org/10.1002/we.1822, 2016. a, b
Howland, M., Bossuyt, J., Martinez-Tossas, L., Meyers, J., and Meneveau, C.: Wake Structure of Wind Turbines in Yaw under Uniform Inflow Conditions, J. Renew. Sustain. Ener., 8, 043301, https://doi.org/10.1063/1.4955091, 2016. a
Jiménez, Á., Crespo, A., and Migoya, E.: Application of a LES technique to characterize the wake deflection of a wind turbine in yaw, Wind Energy, 13, 559–572, https://doi.org/10.1002/we.380, 2010. a
Kim, S.-H., Shin, H.-K., Joo, Y.-C., and Kim, K.-H.: A study of the wake effects on the wind characteristics and fatigue loads for the turbines in a wind farm, Renew. Energ., 74, 536–543, https://doi.org/10.1016/j.renene.2014.08.054, 2015. a
Knudsen, T., Bak, T., and Svenstrup, M.: Survey of wind farm control-power and fatigue optimization, Wind Energy, 18, 1333–1351, https://doi.org/10.1002/we.1760, 2014. a
Kragh, K. A. and Hansen, M. H.: Load alleviation of wind turbines by yaw misalignment, Wind Energy, 17, 971–982, https://doi.org/10.1002/we.1612, 2014. a, b
Krogstad, P.-A. and Adaramola, M. S.: Performance and near wake measurements of a model horizontal axis wind turbine, Wind Energy, 15, 743–756, https://doi.org/10.1002/we.502, 2012. a
McKay, P., Carriveau, R., and Ting, D. S.-K.: Wake impacts on downstream wind turbine performance and yaw alignment, Wind Energy, 16, 221–234, https://doi.org/10.1002/we.544, 2013. a, b
Micallef, D. and Sant, T.: Wind Turbines – Design, Control and Applications, InTech, Chapter 2, A review of wind turbine yaw aerodynamics, 27–53, https://doi.org/10.5772/63445, 2016. a
Ozbay, A., Tian, W., Yang, Z., and Hu, H.: Interference of wind turbines with different yaw angles of the upstream wind turbine, AIAA Fluid Dynamics Conference and Exhibit, AIAA 2012-2719, 2012. a
Pierella, F. and Sætran, L.: Wind tunnel investigation on the effect of the turbine tower on wind turbines wake symmetry, Wind Energy, 20, 1753–1769, https://doi.org/10.1002/we.2120, 2017. a
Ryi, J., Rhee, W., Hwang, U., and Choi, J.-S.: Blockage effect correction for a scaled wind turbine rotor by using wind tunnel test data, Renew. Energ., 79, 227–235, https://doi.org/10.1016/j.renene.2014.11.057, 2015. a
Sarlak, H., Nishino, T., Martinez-Tossas, L., Meneveau, C., and Sørensen, J.: Assessment of blockage effects on the wake characteristics and power of wind turbines, Renew. Energ., 93, 340–352, https://doi.org/10.1016/j.renene.2016.01.101, 2016. a
Schepers, J. G., Boorsma, K., and Munduate, X.: Final Results from Mexnext-I: Analysis of detailed aerodynamic measurements on a 4.5 m diameter rotor placed in the large German Dutch Wind Tunnel DNW, J. Phys. Conf. Ser., 555, 012089, https://doi.org/10.1088/1742-6596/555/1/012089, 2014. a
Schottler, J., Hölling, A., Peinke, J., and Hölling, M.: Wind tunnel tests on controllable model wind turbines in yaw, AIAA 34th Wind Energy Symposium, p. 1523, https://doi.org/10.2514/6.2016-1523, 2016. a, b
Schottler, J., Hölling, A., Peinke, J., and Hölling, M.: Brief communication: On the influence of vertical wind shear on the combined power output of two model wind turbines in yaw, Wind Energ. Sci., 2, 439–442, https://doi.org/10.5194/wes-2-439-2017, 2017. a
Schottler, J., Bartl, J., Mühle, F., Sætran, L., Peinke, J., and Hölling, M.: Wind tunnel experiments on wind turbine wakes in yaw: redefining the wake width, Wind Energ. Sci., 3, 257–273, https://doi.org/10.5194/wes-3-257-2018, 2018. a
Schreiber, J., Cacciola, S., Campagnolo, F., Petrovic, V., Mourembles, D., and Bottasso, C. L.: Wind shear estimation and wake detection by rotor loads – First wind tunnel verification, J. Phys. Conf. Ser., 753, 032027, https://doi.org/10.1088/1742-6596/753/3/032027, 2016. a
Sørensen, J., Shen, W., and Mikkelsen, R.: Wall correction model for wind tunnels with open test section, AIAA J., 44, 1890–1894, 2006. a
van Dijk, M., van Wingerden, J.-W., Ashuri, T., and Li, Y.: Wind farm multi-objective wake redirection for optimizing power production and loads, Energy, 121, 561–569, https://doi.org/10.1016/j.energy.2017.01.051, 2017. a, b
Vollmer, L., Steinfeld, G., Heinemann, D., and Kühn, M.: Estimating the wake deflection downstream of a wind turbine in different atmospheric stabilities: an LES study, Wind Energ. Sci., 1, 129–141, https://doi.org/10.5194/wes-1-129-2016, 2016. a
Wheeler, A. J. and Ganji, A. R.: Introduction to engineering experimentation, Upper Saddle River, NJ, USA, Pearson/Prentice Hall, XI, third edn., 2004. a