the Creative Commons Attribution 4.0 License.
the Creative Commons Attribution 4.0 License.
 | 18 Dec 2018
Experimental validation of a ducted wind turbine design strategy
Benjamin Kanya
Kenneth D. Visser
A synergistic design strategy for ducted horizontal axis wind turbines (DWTs), utilizing the numerical solution of a ducted actuator disk system as the input condition for a modified blade element momentum method, is presented. Computational results of the ducted disk have shown that the incoming flow field for a DWT differs substantially from that of a conventional open rotor. The rotor plane velocity is increased in the ducted flow field, and, more importantly, the axial velocity component varies radially. An experimental full-scale 2.5 m rotor and duct were designed, using this numerical strategy, and tested at the University of Waterloo's wind turbine test facility. Experimental results indicated a very good correlation of the data with the numerical predictions, namely a doubling of the power output at a given velocity, suggesting that the numerical strategy can provide a means for a scalable design methodology.
- Article
(8892 KB) - Full-text XML
- BibTeX
- EndNote


Wind energy has long been acknowledged as having the potential to supplement and even displace the carbon-based fuel needs of our society. The wide adoption of small wind energy, namely that with a swept rotor area of less than 200 m2, has been hampered, however, by higher unit costs and lower efficiency than that of their large-scale counterparts. Studies on small turbines at Clarkson University have focused on improving their efficiency, particularly at lower wind speeds, with a focus on the key metric of cost per unit energy produced, namely USD kWh−1. Increasing the energy extraction for a given turbine size or reducing the manufacturing and operating costs are both options that increase the adoption of small wind by consumers. Other important factors that must also be considered include noise signature issues, sensitivity to wind directional changes, and issues of visibility and community acceptance.
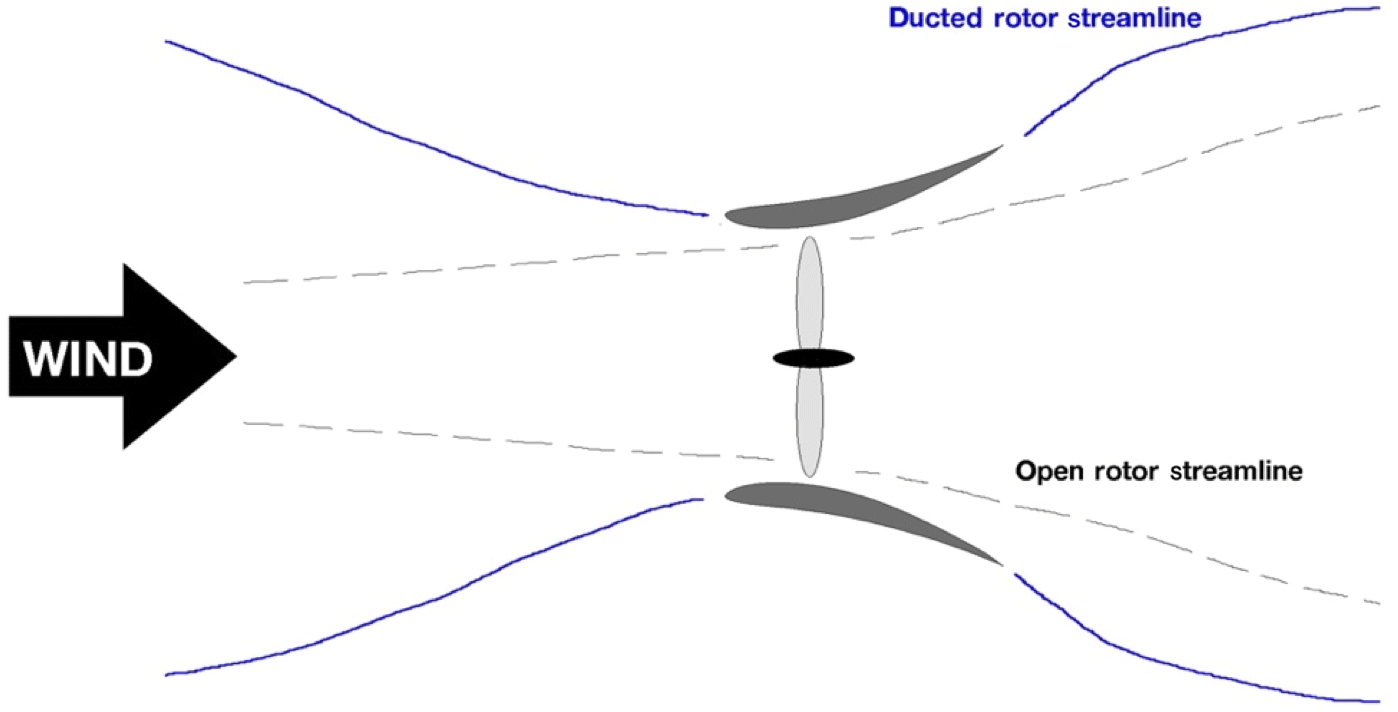
The ducted wind turbine (DWT) concept has been fraught with controversy over the years yet still shows promise in improving the USD kWh−1 issue. DWTs are created by enclosing a conventional horizontal axis wind turbine with a lifting surface geometry revolved around the rotor axis. The duct captures a larger stream tube than an open rotor, as illustrated in Fig. 1. A substantial increase in velocity, exceeding even the free stream, is observed at the rotor face and the associated increase in mass flow rate increases the power output of the turbine. A properly designed DWT can improve the key areas mentioned above, leading to a much more effective small turbine design. There are, however, issues with DWTs that need to be addressed before their full potential can be realized, the foremost being the tradeoff of increased energy production against the increased use of materials, which usually results in a higher unit cost.
This paper reports on recent experimental results that validate a synergistic design strategy of the duct and the rotor. The numerical flow field of the optimized ducted actuator disk geometry is used as the input to the blade element momentum rotor design code. In this way, the influence of the duct on the flow field of the rotor is accounted for and the rotor geometry modified appropriately.
Although studies on the potential performance gains of ducted turbines can be traced back to the 1920s, Foreman and Gilbert's (1979), Foreman et al.'s (1978) and Gilbert et al.'s (1978) extensive testing in the 1970s proposed that this occurred because the duct reduces the pressure behind the turbine, relative to that behind a conventional wind turbine, causing more air to be drawn through. They suggested that they could have a performance efficiency of Cp=1.57, defined as
where A is the rotor area. The maximum Cp for an un-ducted open rotor is 0.593, commonly known as the Betz limit. This leads to the definition of an “augmentation ratio” of r=2.65, where
Hanson (2008) suggested that it is the lift generated by the shroud, as shown by de Vries (1979), that induces an increased mass flow through the rotor, resulting in an increase in the power coefficient proportional to the mass flow. Although one might surmise that, via this increased mass flow rate and velocity, a DWT can then exceed the Betz limit, this is incorrect because a much larger stream tube has been captured, and the assumptions applied to the open-rotor case do not apply per se. Unfortunately, such claims by inventors that they have “beaten Betz” have only served to give DWTs a bad reputation.
Many studies have investigated the feasibility and associated augmentation factors seen in DWTs in an effort to further their development (Hu and Cheng, 2008; Igra, 1976, 1984; Hansen et al., 2000; Werle and Presz Jr., 2008; van Bussel, 2007; Oman et al., 1977; Leoffler Jr. and Vanderbilt, 1978; Ohya et al., 2002, 2008; Politis and Koras, 1995; and Jamieson, 2009) with the largest prediction of 7 by Badawy and Aly (2000); however, conclusions have been quite varied. Werle and Presz Jr. (2008) used fundamental momentum principles and concluded that the possible augmentation factor could only approach 2 and that earlier studies had incorrect assumptions, leading to overly optimistic predictions. Hansen et al.'s (2000) viscous numerical results predicted ideal Cp values approaching 0.94, and an augmentation factor of 1.6. He also indicated that if the duct geometry could be made to keep the flow attached, the augmentation factor could be improved further.
A review article by van Bussel (2007) substantiates the above arguments regarding mass flow and indicates that the increase in the mass flow, and thus the augmentation ratio, is proportional to the ratio of the diffuser area to the rotor area. He concludes that the amount of energy extracted per unit volume of air with a DWT remains the same as for a bare rotor, but since the volume of air has increased, so has the total energy extracted. He also noted that Cp values above 1, corresponding to augmentation ratios on the order of 2, are achievable with diffuser-to-inlet area ratios on the order of 2.5. In addition to the experimental data, van Bussel reported on the effect of reducing the back pressure, which can also have a profitable effect on the performance.
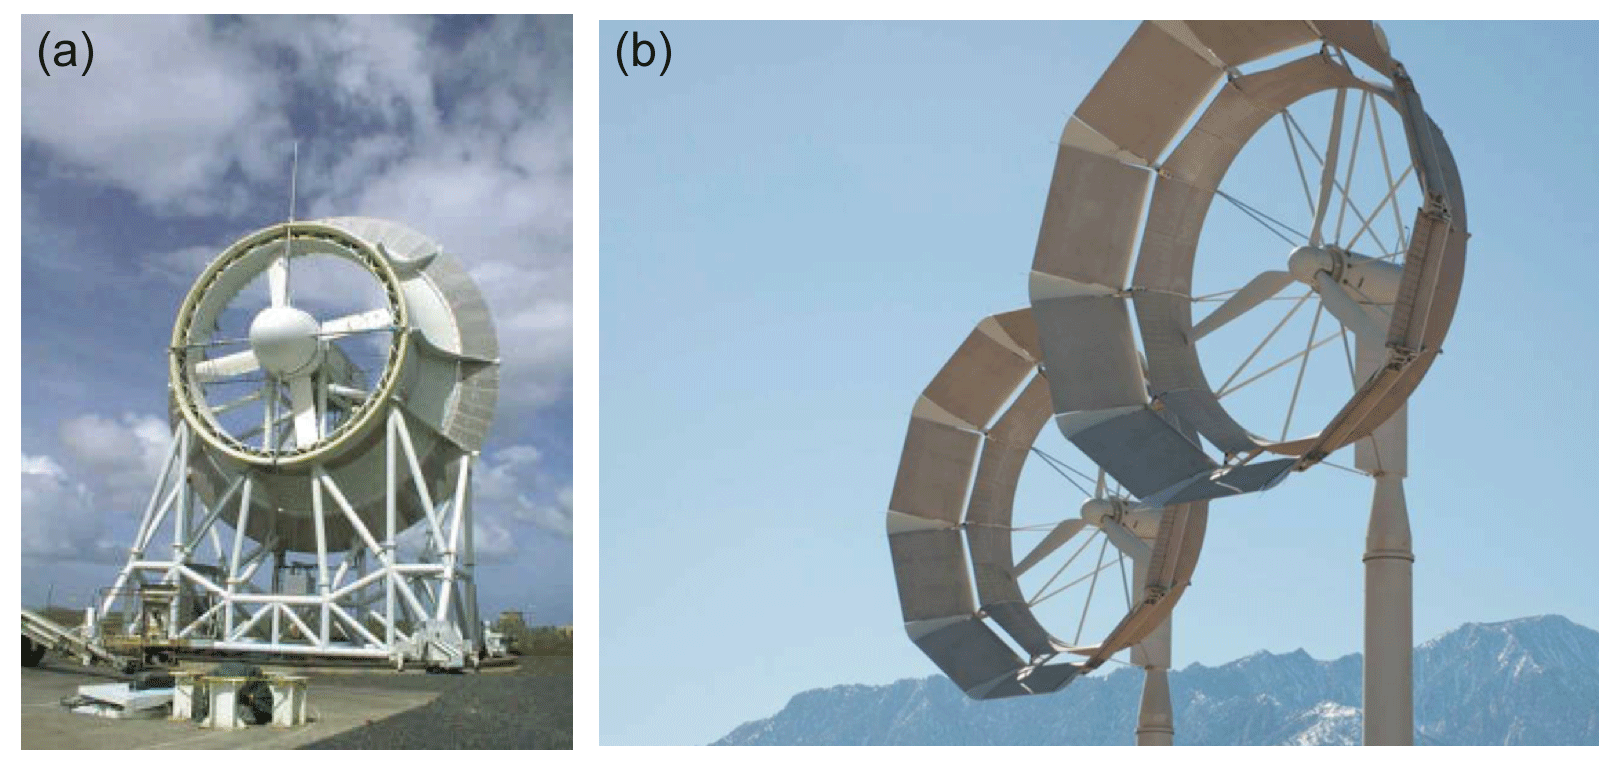
This potential increase in power generation has continued to drive DWT research; however, no commercial design has been able to realize these augmentation factors and no commercially viable DWT has been successful. A good example of this type of failure is seen in the Vortec 7 from New Zealand in Fig. 2a (Phillips, 2003; Windpower Monthly, 2018). A more recent example is that of the demise of Ogin (Boston Globe, 2018) in Fig. 2b. Perhaps the most promising experimental field results have been that of Ohya at Kyushu University in Japan on ducted turbines with a brim at the trailing edge (Ohya, 2014). Experimental data have been obtained on several units, including 500 W, 3 kW, 5 kW and 100 kW units, with measured power coefficients approaching a Cp=1.0. Ohya (2014) also reported no appreciable increase in the noise levels generated by the turbine while running.
Recent results of a synergistic design strategy coupling the duct flow field to the rotor design at Clarkson University have indicated two key design aspects. First, the presence of the duct modifies the axial velocity at the rotor, as shown in Fig. 3a (Jedamski and Visser, 2013) from a nominally uniform distribution to one with a radial variation. Second, moving the rotor to a location aft of the throat (Fig. 3b) provides an increased power output for a given duct geometry (Visser, 2016). Most rotor designs seek to exploit the high velocity at the throat of the duct; however, the presence of the rotor modifies the velocity where it is stationed, and more power can be extracted from the design, for a given duct, by moving the rotor aft. The optimum blade design for the rotor is not that which would be required of an open rotor but is different in planform shape and twist, due to the presence of the flow field generated by the duct. Venters et al. (2017) have also indicated Cp values, based on the duct exit area, of greater than 0.593, possibly pointing the way for a wind energy extraction device that is more efficient than a turbine of equal diameter.
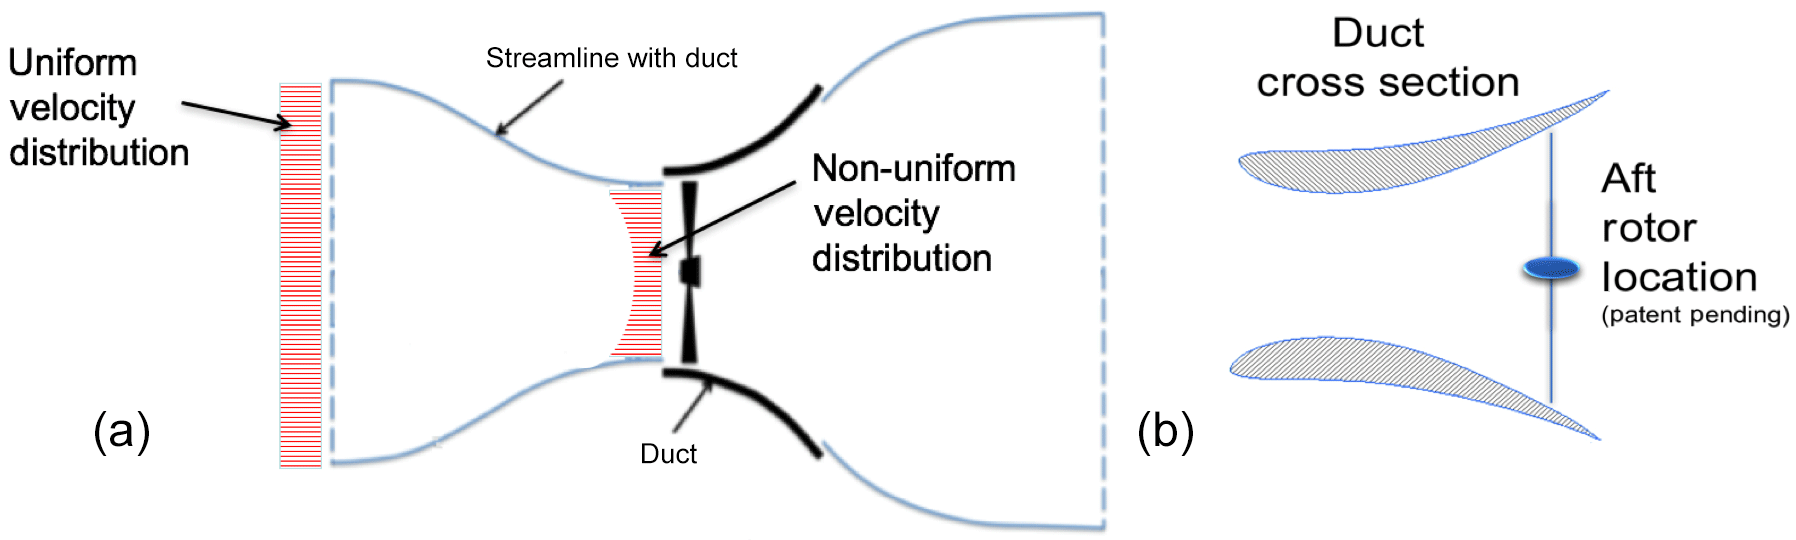
Figure 3Key design aspects for the Clarkson ducted turbine. (a) Non-uniform velocity distribution. (b) Aft rotor location.
Perhaps the most enticing aspect of the DWT concept is the potential for increased energy production in lower speed wind regimes, opening up many more areas to a viable distributed wind energy solution. Based on the above promising results, this investigation was undertaken to experimentally validate the synergistic design strategy.
In order to make a comparison of the experimental data to existing available turbines, a rotor diameter of 2.5 m was selected for the design to compare it to a commercially available turbine, the Excel 1 by Bergey Windpower (2017). The Excel 1, illustrated in Fig. 4, is a 2.5 m diameter open rotor with a maximum output of 1.2 kW. The blades are constant chord and untwisted. The 2.5 m ducted prototype rotor was designed specifically for the ducted turbine environment. The test plan focused first on evaluating the open-rotor design against the Bergey open rotor and then examining the effect of the duct. Details of the numerical design are presented below followed by the experimental methods overview.

3.1 Numerical approach
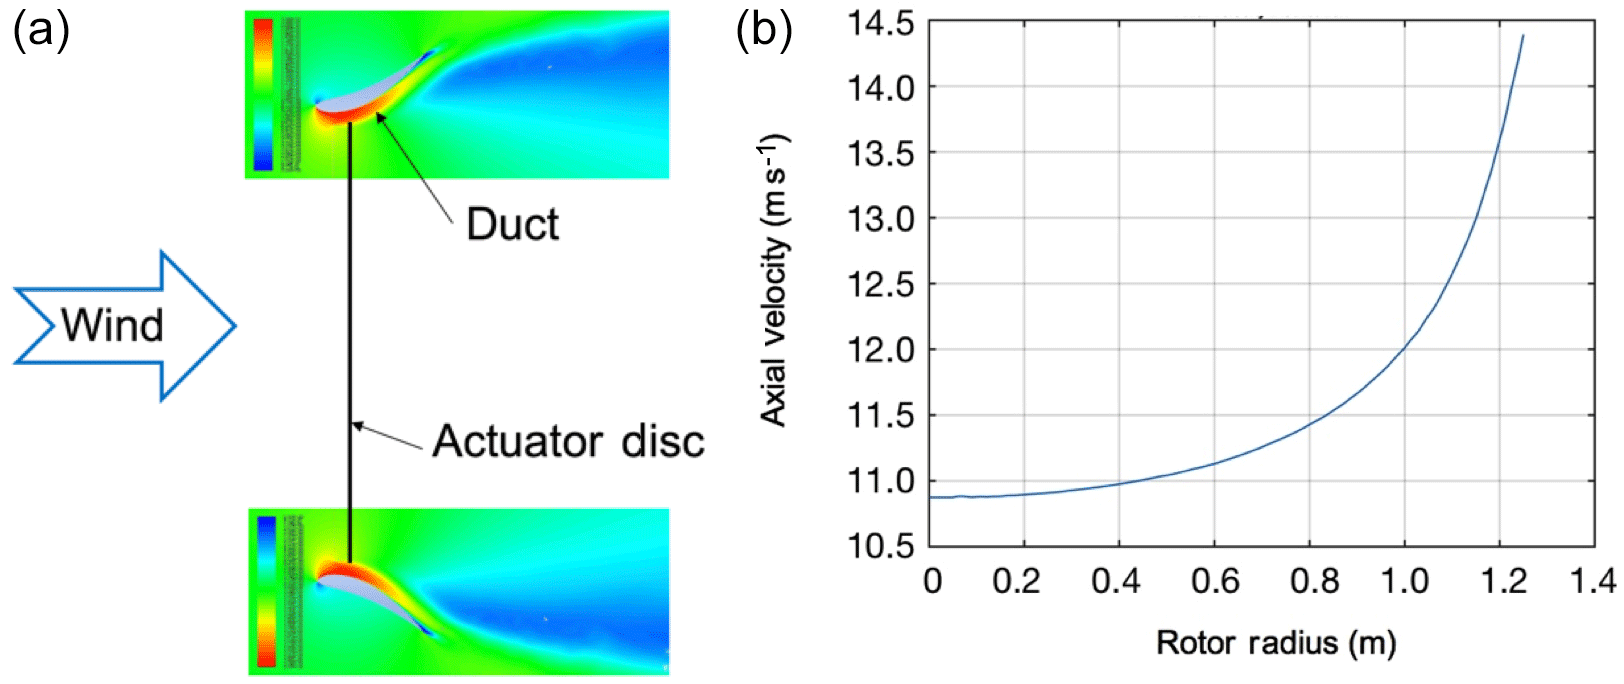
The numerical design strategy used a two-part scheme. First, the flow field of the duct, with an actuator disk, was determined using the Navier–Stokes solver FLUENT. The grid had a boundary layer mesh with a growth rate of 1.1 and the first mesh point was set at . The boundary layer thickness was calculated as a function of Rec, based on duct chord, for each case and enough inflation layers were used to span the entire boundary layer to make sure the most accurate results that one can obtain from a Reynolds averaged Navier–Stokes (RANS) numerical solution were obtained. The actuator disk was covered with 200 quadrilateral elements (i.e., for the 2.5 m rotor, each element in our axisymmetric model covered 6.25 mm) to model the turbine in the 2-D axisymmetric model. There was a refined unstructured triangular grid around the duct which was surrounded by a large structured quadrilateral grid covering further the upstream and downstream of the actuator disk. The rest of the domain was meshed with unstructured quadrilateral elements. As mentioned above, the boundary layer thickness and y+ was calculated for each case. The k−ω shear stress transport (SST) turbulence model was utilized, which, among the two-equation turbulence models, gives better prediction of flow separation. Further details of the methods employed can be found in Bagheri-Sadeghi et al. (2018), and an example of the solution is shown in Fig. 5a.
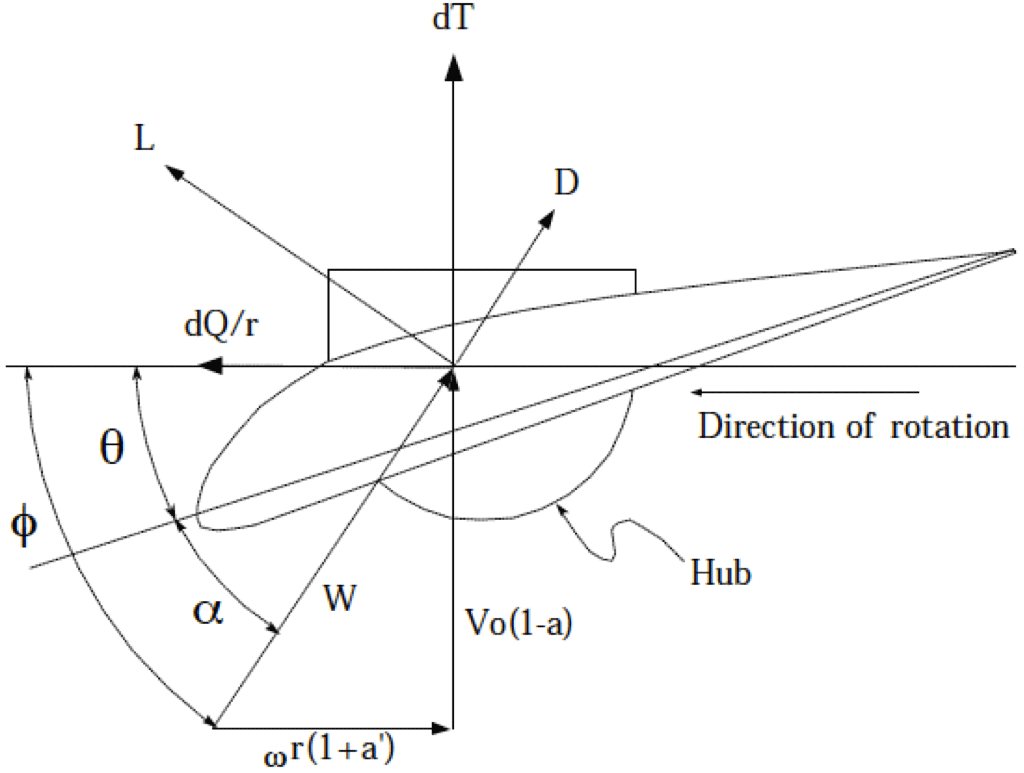
From the field solution, the axial velocity field was then extracted (Fig. 5b) and used as an input for Clarkson's in-house blade element momentum (BEM) code, mRotor. The rotor design in mRotor uses a fairly standard BEM strategy by Glauert to determine the optimum rotor shape (Kanya and Visser, 2010). Figure 6 illustrates the typical forces and velocities, including the axial induction factor “a”, the factor by which the upstream flow velocity is slowed by the time it reaches the rotor plane. For an ideal open rotor, to maximize the power extracted. Other local variables at radius, r, to be noted include the following: θ, the blade pitch angle; α, the angle of attack; ϕ, the angle which the velocity vector, W, makes with the rotor plane; ω, the angular velocity; dQ, the elemental torque; dT, the elemental thrust; Vo, the upstream velocity; L, lift; D, drag; and a′, the angular velocity induction factor.
In addition to obtaining the rotor plane velocity profile from the numerical solution, a second piece of information, the thrust coefficient at the rotor, CT, rotor, was also extracted and the axial interference factor, a, was determined for input to mRotor from the following relation:
where
It is important to note that when designing a rotor, one is often, as is the case here, designing for a given generator. In this case, as the generator was a 1.8 kW unit, requiring about 45 N m at the 480 rpm rated speed, it was critical that the rotor could deliver this torque at that RPM. This usually means a compromise with the ideal aerodynamic tip speed ratio, TSR, that being the ratio of the tip speed of the blade to that of the oncoming velocity. In addition, it was desired to use a simple airfoil, namely a curved flat plate like the GOE417a because of the lower RPM. Airfoils such as these work well in low Reynolds number environments, and an additional goal for the turbine was a cheaper manufacturing strategy. Since the optimum TSR is a function of the airfoil performance (Kanya and Visser, 2010), the selection of a less than optimal airfoil can be a better choice for a lower TSR rather than having a better-performing airfoil operating in an off-design condition.
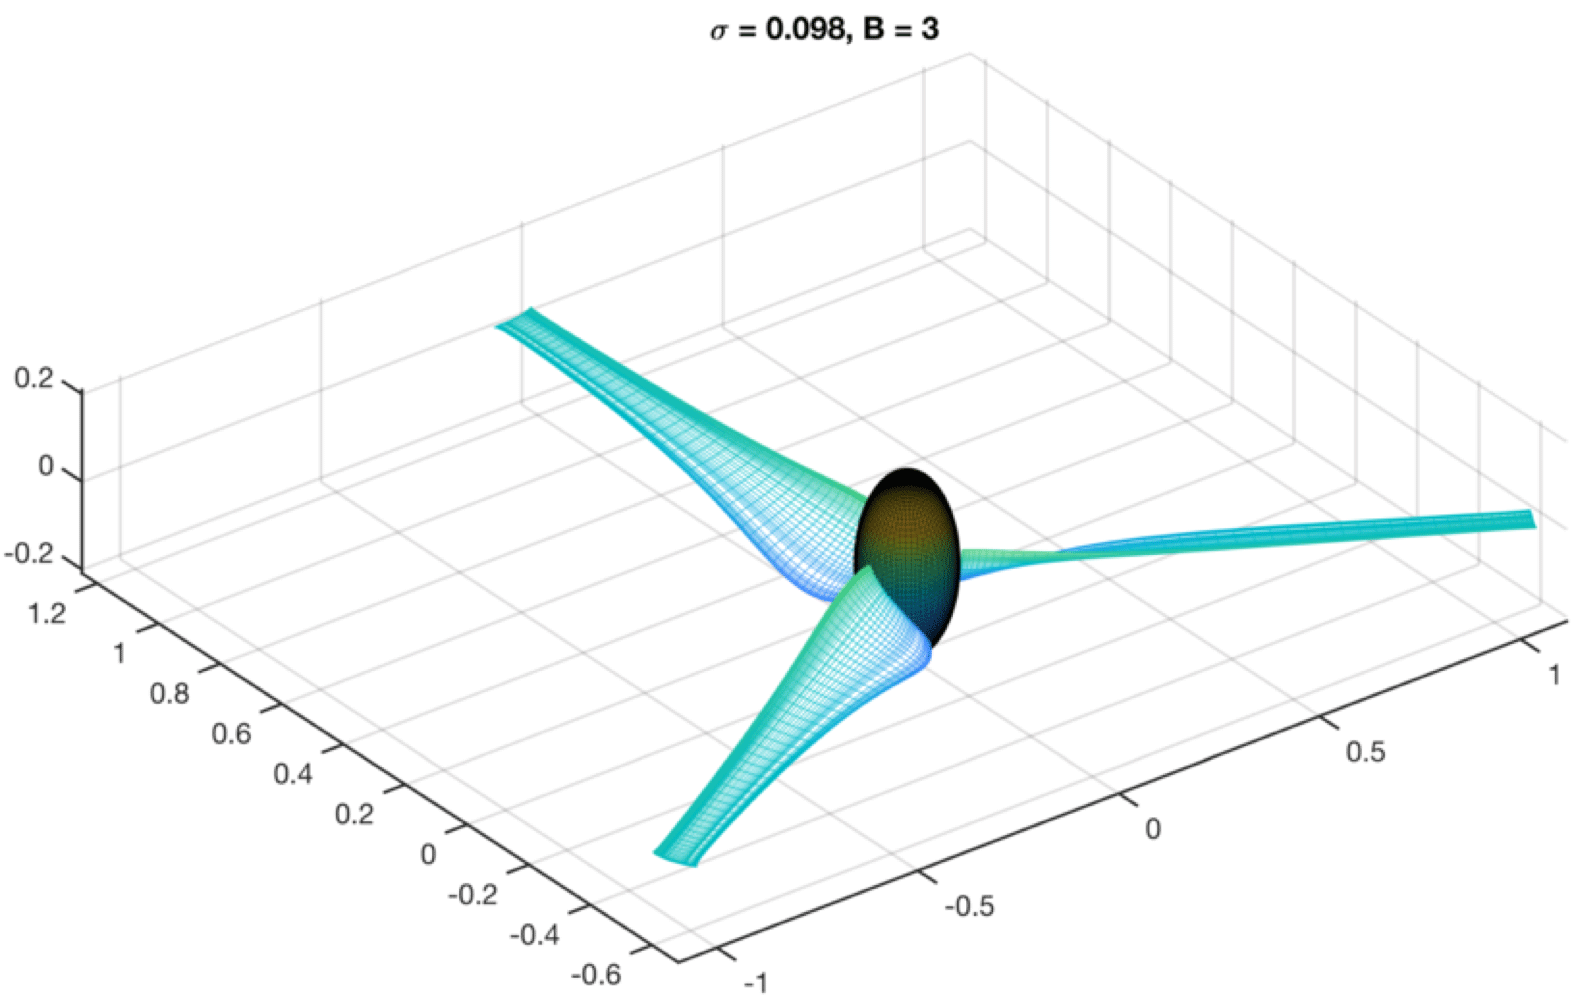
The design TSR was set to 4, and the blade number selected was 3, despite the slightly higher aerodynamic gain potential with added blades. The presence of the duct mitigates the tip losses to some extent and, when coupled with a constraint on the budget, pushed the design to a three-bladed configuration. Figure 7 illustrates the final design of the rotor with a solidity of 9.8 %.
3.2 Experimental setup
The Clarkson DWT was designed as a prototype for the NEXUS-NY competition funded by the New York State Energy and Research Development Authority. Since the goal was to undergo wind tunnel testing, many of the requirements of a commercially viable turbine, such as a yaw bearing and weatherproofed materials, were not required and were not included in this prototype build.
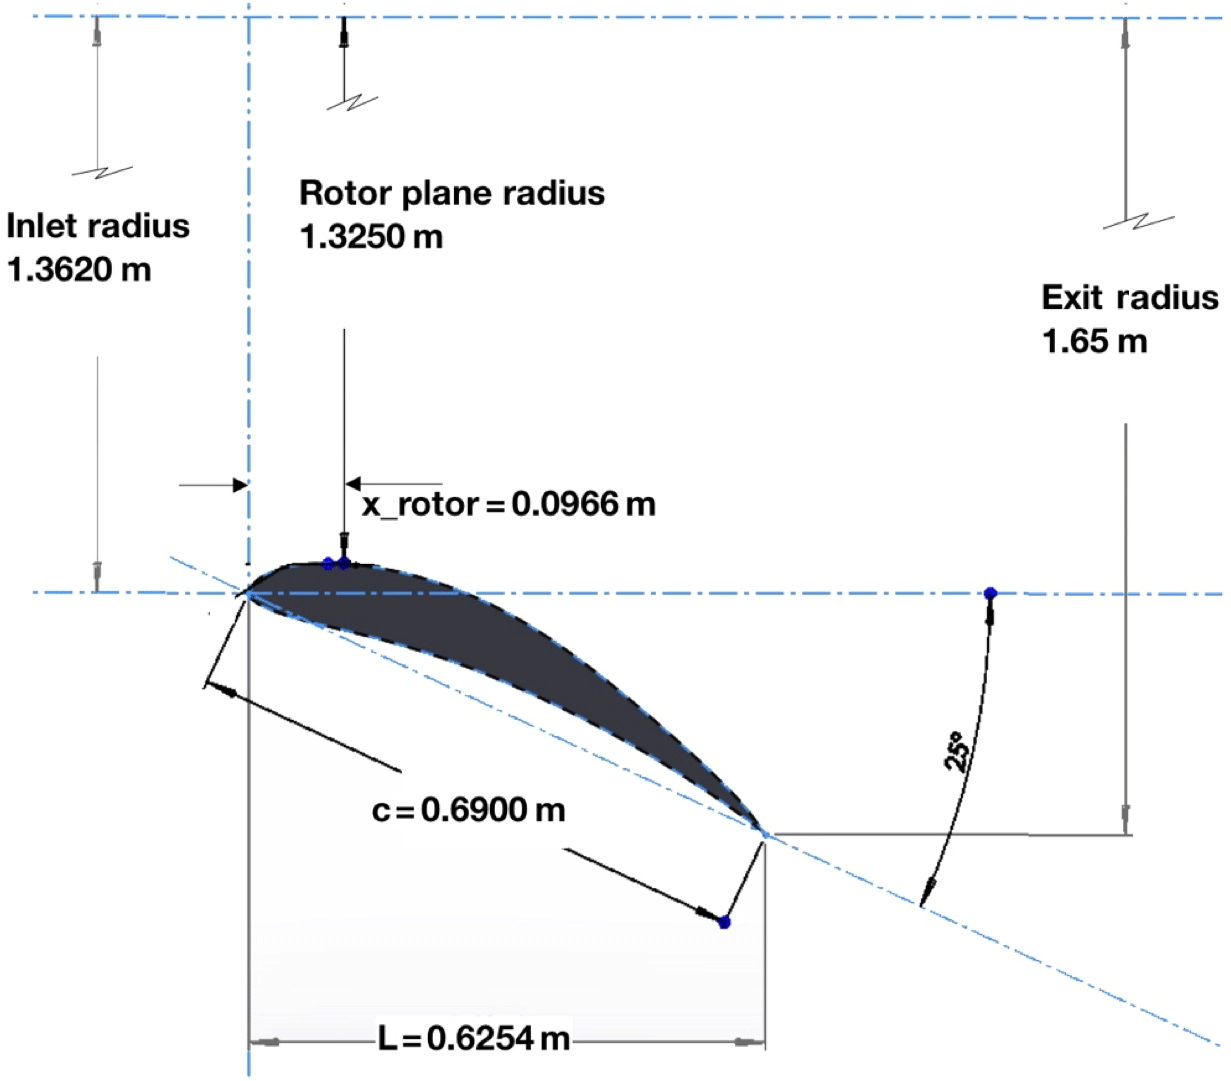
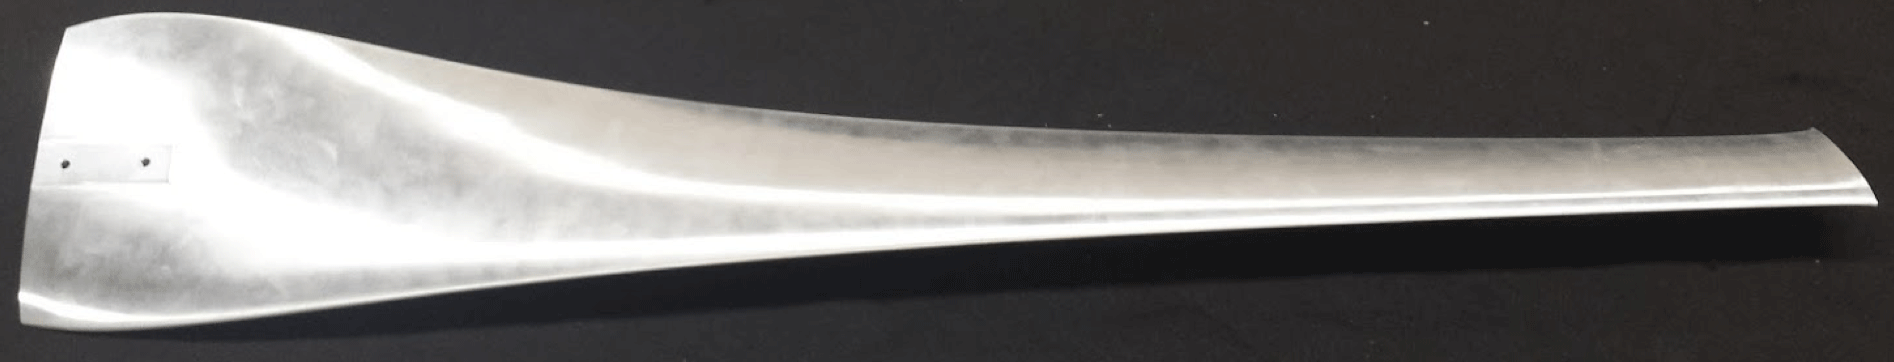
The duct, illustrated by the geometry of Fig. 8, was constructed out of expanded polystyrene (EPS) foam covered in a StyroSpray polymer, as shown in Fig. 9. The exit diameter of the duct was 3.3 m leading to a ratio of the exit area to the rotor area of 1.74. The ratio of the duct length to rotor diameter and to exit area was 0.25 and 0.19, respectively. The rotor blades, one of which is shown in Fig. 10, were numerically milled from aluminium to match the BEM design with a mounting boss that enabled them to be bolted to the hub. The rotor was attached to a 1.8 kW radial flux permanent magnet generator from Ginlong, model GL-PMG-1800. The three-phase AC generator output was rectified through a Microsemi MSD52 glass passivated three-phase rectifier bridge and the DC measured with a BK Precision 8522 programmable DC electronic loads unit.

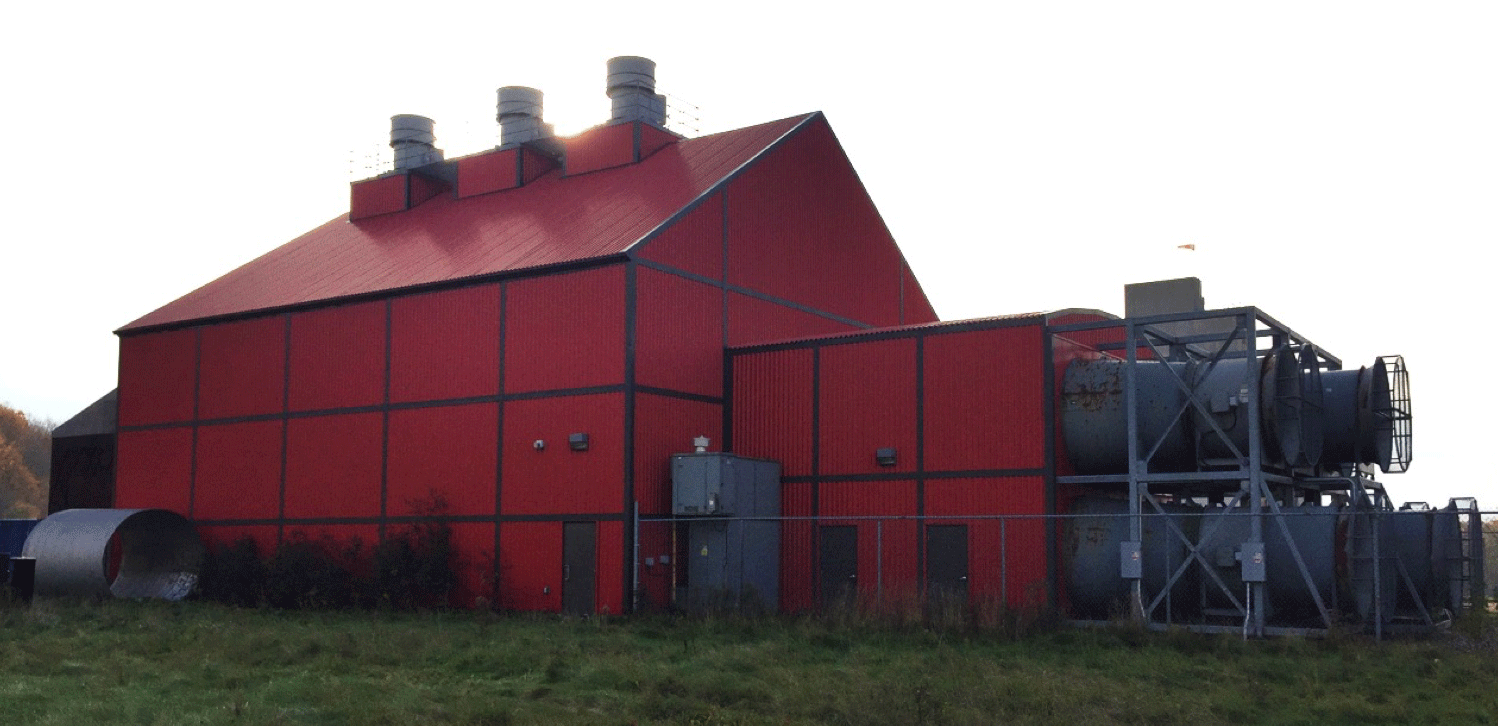
Wind tunnel testing was conducted in November 2016 at the University of Waterloo wind turbine test facility in Waterloo, Ontario, Canada. An exterior view of the facility highlighting the six external fan–blower array is shown in Fig. 11. The uniformity of the wind was not explicitly mapped. The flow field was generated by a bank of 6100 hp fans with independent variable speed control. Data were acquired with a single location sonic anemometer. At a given velocity setting the flow field was sampled with a handheld anemometer and compared to the single point. The average variation in the incoming flow to the turbine varied by ±1–2 %. The turbulence of the flow field was sampled over the range of the incoming velocities and was found to vary over the range of 5–10 %. The blockage ratio, based on the projected frontal area of the duct and the rotor, for a stationary rotor, was 4.1 %. If the rotating rotor is considered to act as a solid blockage, the ratio would be 11.7 %. No blockage corrections were made.
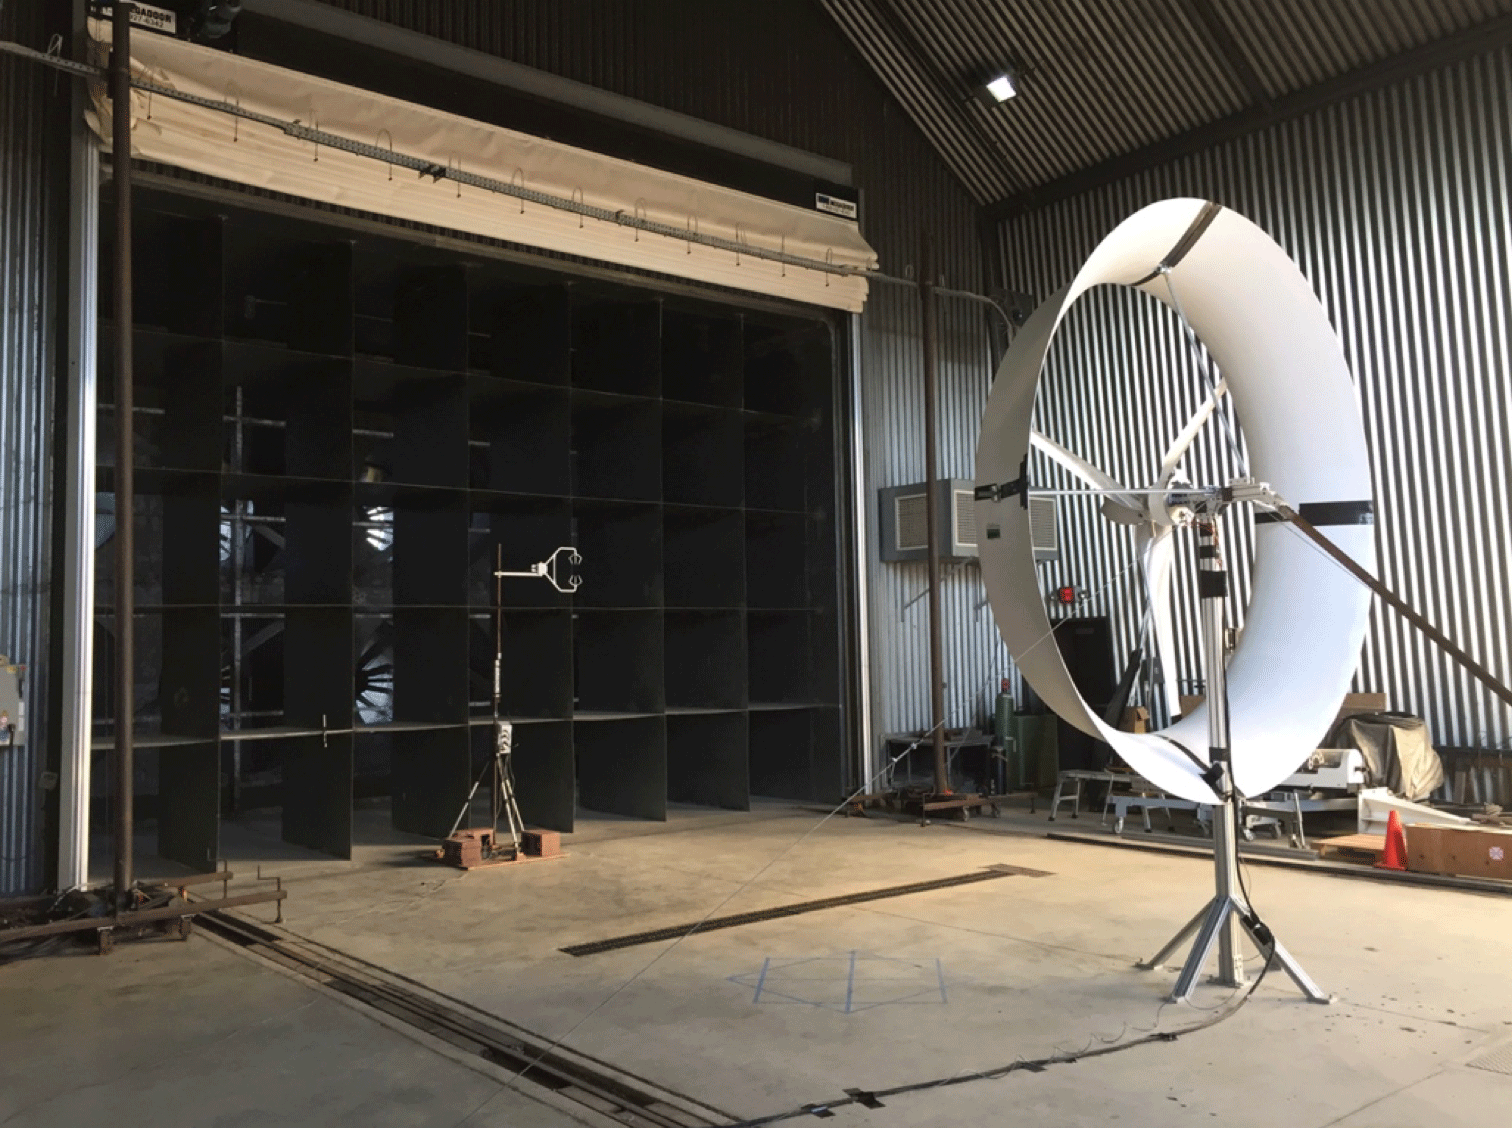
The turbine was first tested in an open-rotor configuration, without a duct, and after a suitable amount of data was acquired, including repeat runs, the duct was attached to the turbine stand and the runs repeated. A one-third view of the test setup including the upstream sonic anemometer is shown in Fig. 12. The duct was subsequently removed and the open-rotor tests repeated. Tunnel velocity was varied in 1 m s−1 increments to a speed that caused to the generator to slightly exceed the maximum rating of 1800 W. Velocity was measured upstream of the rotor with a sonic anemometer. At each velocity test point, the resistive load on the turbine was varied until the power output, namely the product of the voltage and current, was the greatest. RPM was recorded using a magnetic bicycle switch. Since there was no electronic braking circuitry or dump load, for each test point the resistive load was first increased (ohms were lowered), followed by an increase in tunnel speed, to prevent a runaway condition.
The results of the wind tunnel testing are discussed below, with a focus on the power performance. Power results are followed by additional observations on the energy production implications and the behavior of the flow field. During the test, a handheld anemometer was positioned at various locations in the flow field to gain some understanding of the velocity field near the rotor, as the duct did not have pressure taps. It was observed that the velocity at the duct inlet face was about 10–15 % above the upstream reference value across the entire speed range.
4.1 Power performance
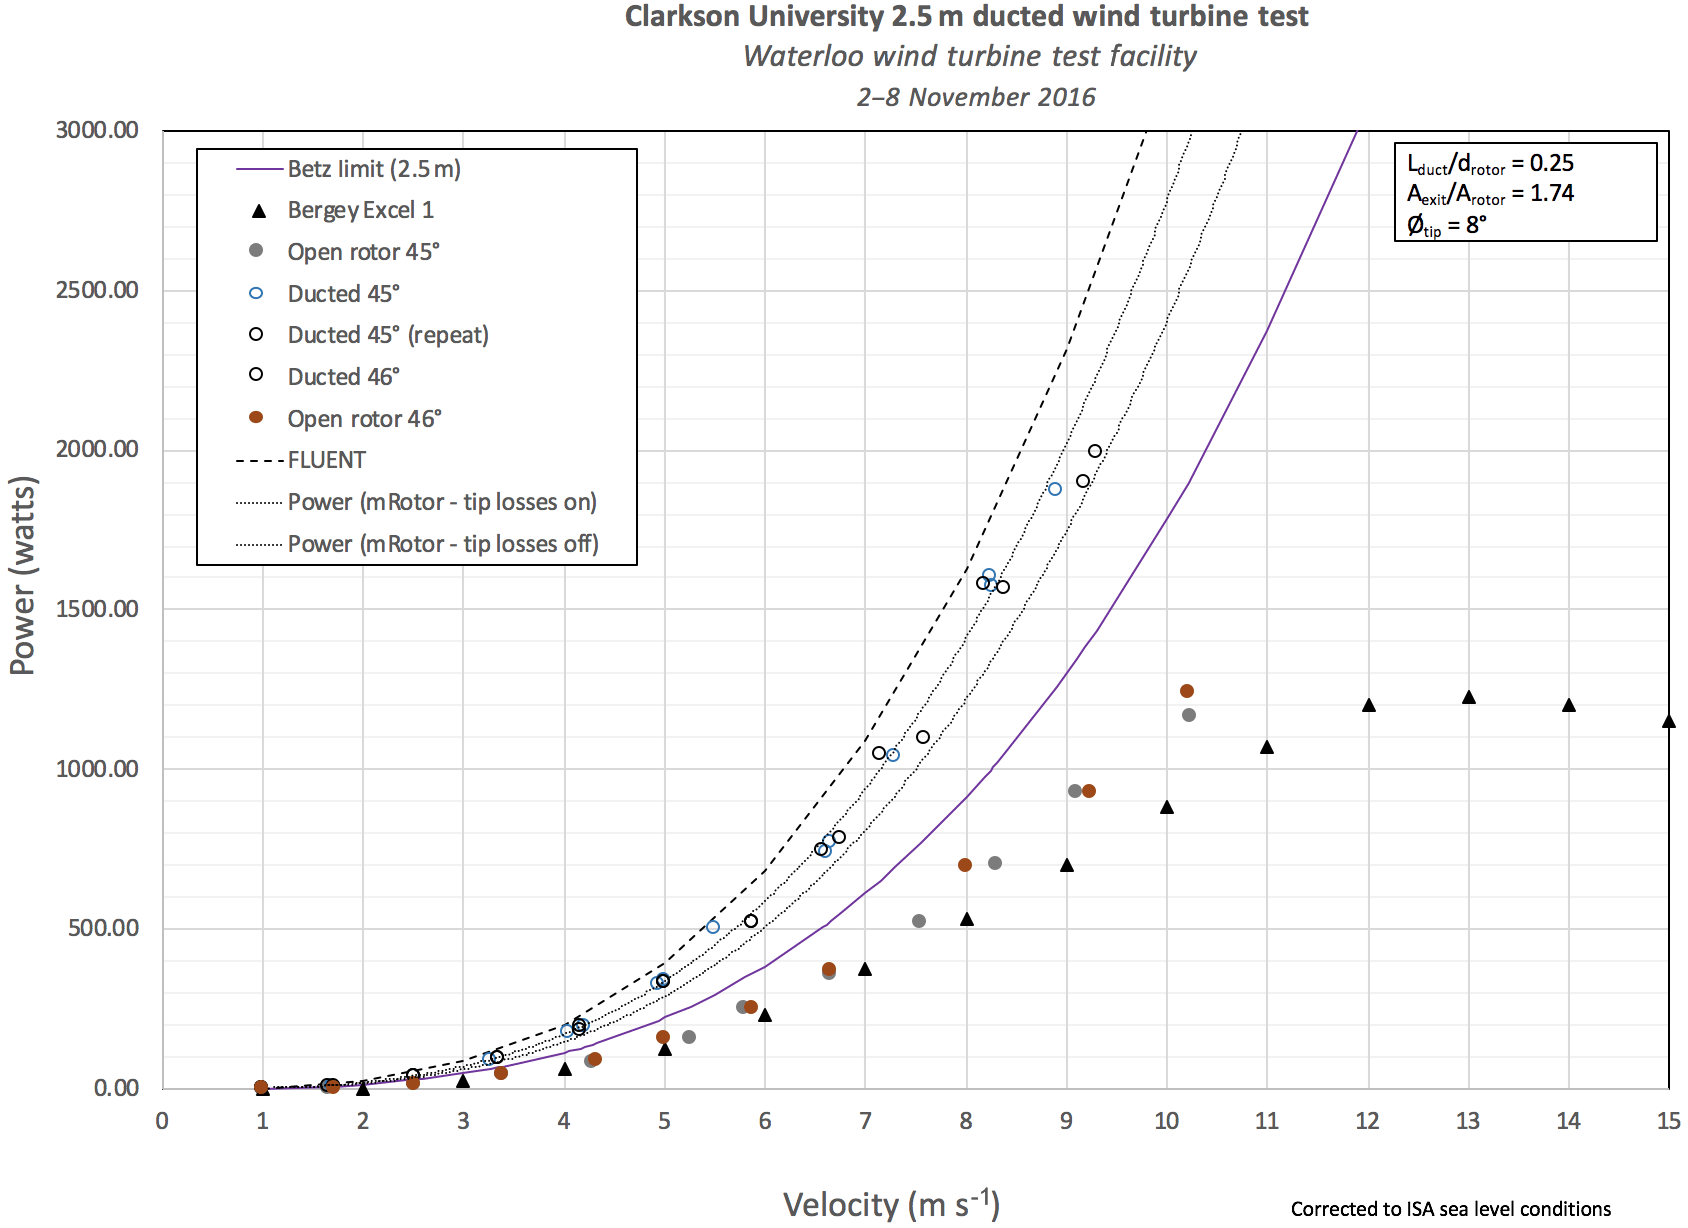
Figure 13 is a plot of the wind tunnel results. The black triangles represent the published power curve of the Bergey Excel 1 turbine. The solid filled circles are the data for the Clarkson open-rotor configuration. These open-rotor tests were conducted with the hub pitch set to 45∘ (nominal) and then 46∘ as an after-check. It can be seen that the performance of the current rotor is slightly better than the Bergey, and this is to be expected. The Bergey uses an untwisted constant chord blade, while the Clarkson blade has an optimum twist and planform distribution. Both sets of data sit below the upper theoretical limit for a 2.5 m open rotor, the Betz limit, as they should, which is denoted by the solid line.
The ducted data are marked by the open circles in Fig. 13. It was observed that the power output substantially increased with the presence of the duct. At 9 m s−1, for instance, the Bergey generated about 700 W, while the Clarkson open-rotor configuration puts out about 925 W. With the duct installed, the turbine output was increased to about 1880 W. Thus, the duct increased the power output to approximately twice the un-ducted configuration. Unfortunately, 9 m s−1 was the highest speed that could be tested, as the generator was producing above the rated output at that speed and could not be increased further.
Perhaps most interesting, however, are the two light grey dotted lines bracketing the data in Fig. 13. These are the predicted output curves from mRotor, with and without the tip loss corrections included, indicating that the ability to synergistically design and predict the performance of the ducted turbine, with the numerical simulation input to the mRotor code, was validated by the wind tunnel data. The last curve on the plot, denoted by the heavy dashed line, is the numerical prediction by the actuator disk model in FLUENT, namely the solution used to generate the input velocity field profile for the mRotor design. The power predicted represents the possible upper limit to the turbine performance. For more details on the numerical input solution, see Bagheri-Sadeghi et al. (2018).
The Cp values, based on the rotor area, were also calculated for the data and are presented in Fig. 14. The Bergey reaches a peak value of about Cp=0.37 at 7 m s−1. The Clarkson open-rotor configuration remains fairly constant at about at Cp=0.41 from 5–9 m s−1. The ducted configuration generated values of about Cp= 0.85–0.90 over the same range. It is important to note that although these values lie above the Betz limit line, this does not in any way indicate that the theoretical Betz limit has been exceeded. That limit applies only to an open rotor. A ducted turbine captures a larger stream tube and one would need to determine what amount of power was in that stream tube to get a sense of the “efficiency” of the ducted turbine.
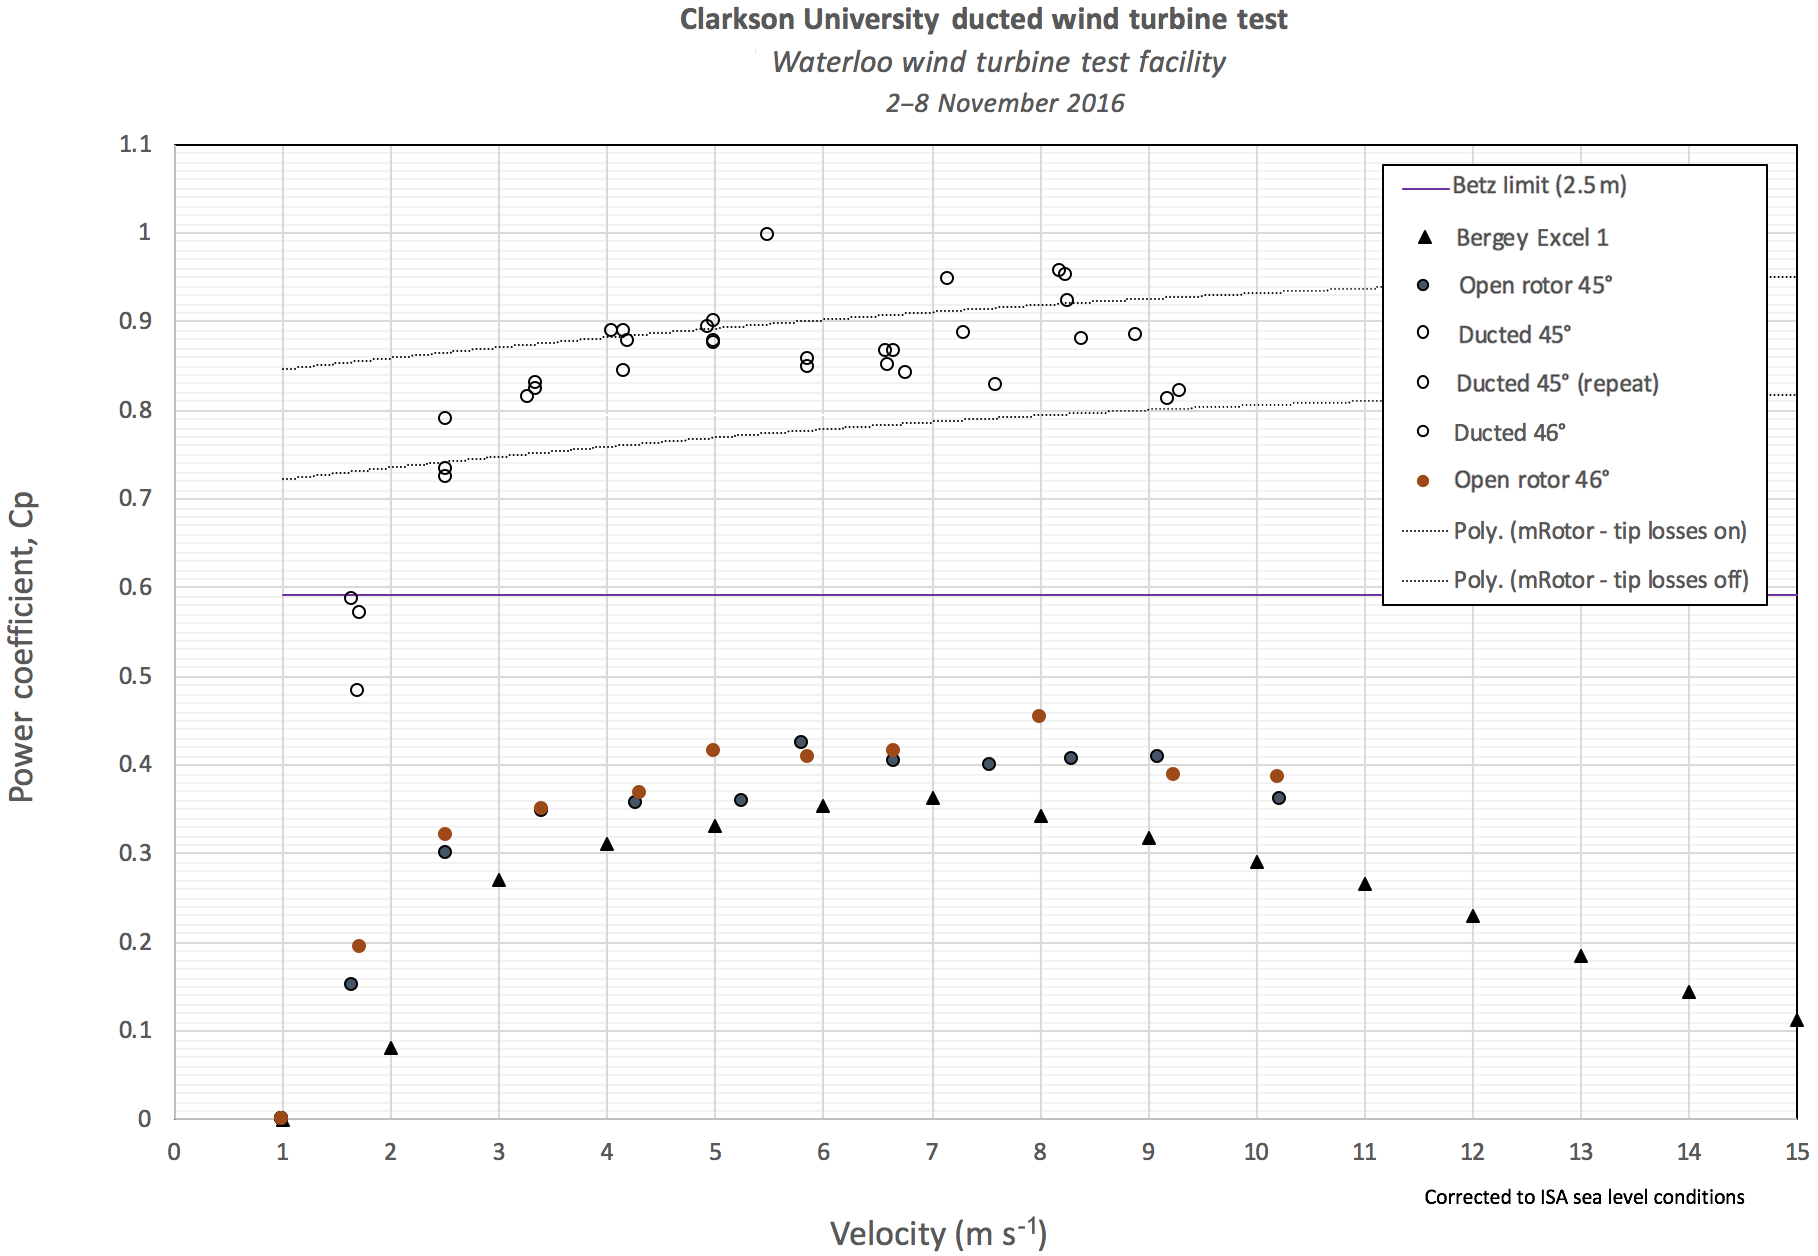
One possibility is to non-dimensionalize the data by the exit area of the duct. Scaling by the maximum projected area of the duct can be argued to be a “fairer” evaluation of the data, when compared to a conventional open-rotor turbine. In the case here, the exit diameter is 3.3 m and the rotor diameter is 2.5 m. Hence the Cp values would all be scaled by the ratio 2.52∕3.32 or a factor of 0.574. Cp values for the ducted configuration would then be in the range of 0.50–0.55, which is still better than an open rotor of this size.
A closer look at the data revealed that the torque was consistently lower than what was predicted, and conversely the RPM values were higher, at each of the operating points. At 1800 W, for instance, there should be around 45–50 N m of torque at 350 rpm; however, an 450–500 rpm was observed, implying the torque to be only 35–37N m. A check on the tip speed ratio values indicated they were also high: above 6 when they were designed to be below 5. Overall, the torque was consistently 30–40 % lower across the speed range, while the RPM values were about 35 % higher than expected.
A series of additional tests were run at a wind speed of approximately 3.3 m s−1 to vary the pitch angle of the blades and observe if the power output could be improved beyond the numerically predicted geometry. Table 1 lists the geometries tested and the output.
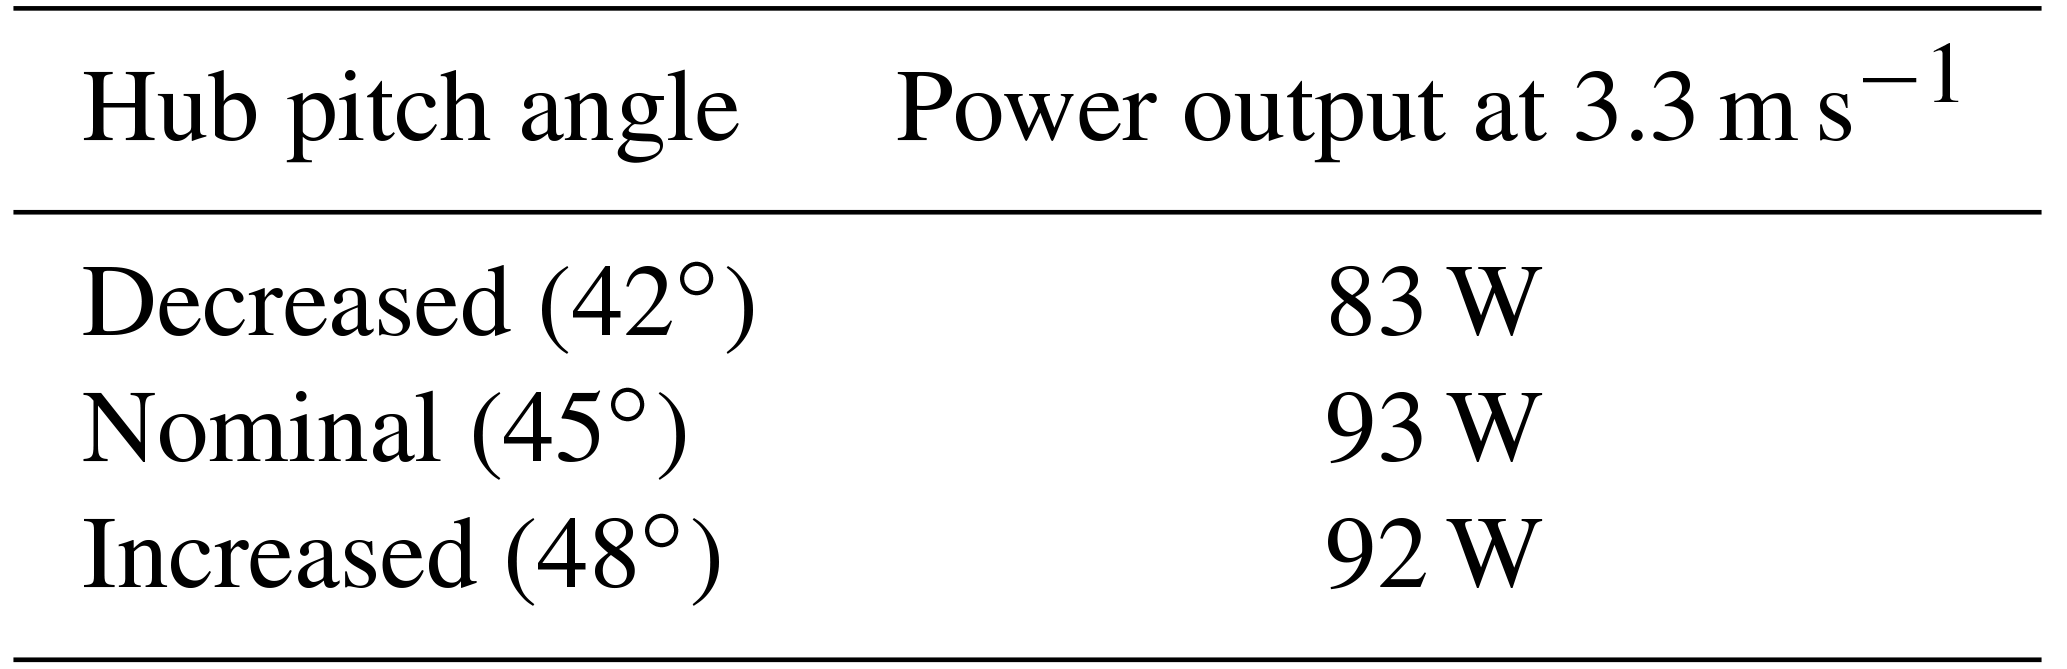
At each condition, the load was varied until the maximum power was obtained. It appeared that the nominal hub pitch angle of 45∘, as predicted by mRotor, was close to, if not the correct setting predicted by mRotor. It also seems that a variation in a degree or two would not impact the performance significantly.
4.2 Energy
Although the efficiency of the power curve is an important characteristic of a turbine's performance, it is the energy generated that is the most important. Society pays for energy, and power is simply the rate at which it is used. Table 2 contains the annual energy produced (AEP) for each configuration based on the typical 5 m s−1 Rayleigh probability distribution (PDF) and the configurations' respective power curves. As can be seen, if the ducted 2.5 m rotor was limited in power output to that of the Bergey Excel 1, namely 1.2 kW, the Clarkson turbine would still produce twice as much energy. Fitting the rotor to a 3.5 kW generator would increase the energy output to approximately 2.7 times that of the Excel 1. This highlights the inadequacy of simply rating a turbine by the power it produces at a given speed, typically 11 m s−1 for small turbines. It is the AEP at a given wind PDF that should be the defining quality.
Table 2AEP comparison of 2.5 m rotors using standard Rayleigh distributions (kWh).
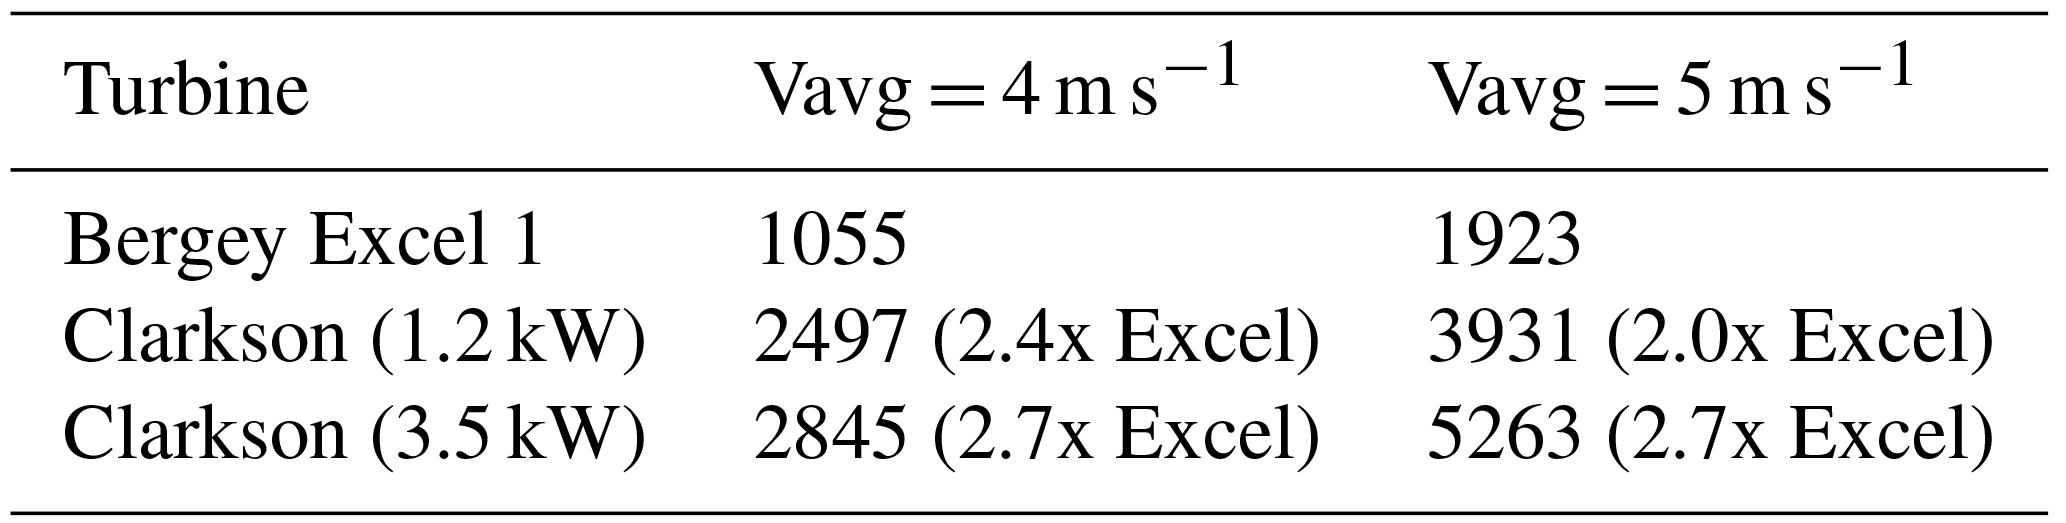
The observed improvement results primarily from an increased performance output of the ducted turbine at low speeds. This can be inferred from the power plot of Fig. 13, but what is not so obvious is the role the PDF of the average wind speed plays. For the 5 m s−1 PDF, the wind is blowing below 6 or 7 m s−1 for the majority of the time. This is why the improved low-speed performance from the duct is so effective on the energy extracted. If a wind regime with the average speed of 4 m s−1 is now considered, the results are even more illustrative, as noted in Table 2. At 4 m s−1, the 1.2 kW ducted configuration now generates 2.4 times more energy than the Bergey. Note, however, that the 3.5 kW advantage is about the same, indicating perhaps that the generator needs to be sized according to the local wind regime as well.
4.3 Flow field issues
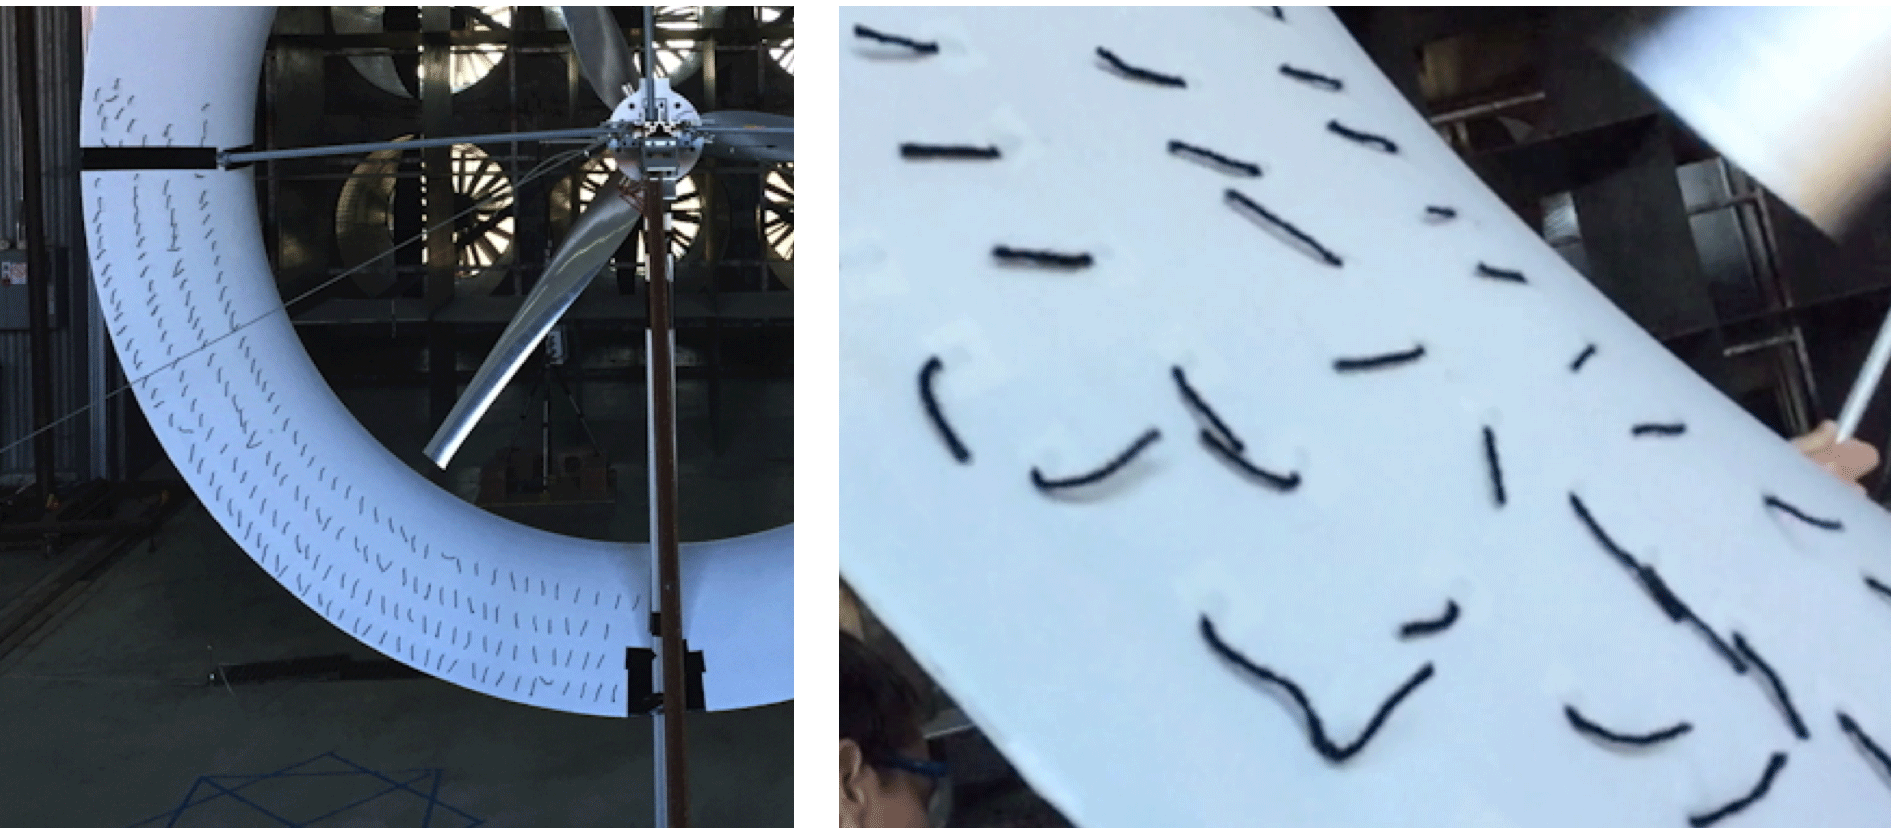
In an effort to understand the flow field a little better, a lower quadrant of the duct was tufted to examine the surface flow as shown in Fig. 15a. The tufts indicated substantial separation behind the support struts and near some regions of the trailing edge. There were also regions of fluctuating separation from the mid-chord of the duct aft to the trailing edge. Figure 15b illustrates an example of this region. The observed fluctuations in the surface flow, causing periodic separation and reattachment, may have been in part due to the upstream blade passage, but it was clear that there were also other frequencies involved. Although only subjective observations were made, a time-averaged separation of more than 50 % could be seen in some regions. In light of this, it is surprising that the overall performance was as good as it was and suggests that changes can be made to the duct geometry to improve the performance.
Although the predictions of power output from the numerical model agreed quite well with the experimental results, there was a notable difference between numerical predictions and experimental results. The numerical model showed very little flow separation on the duct, whereas flow separation was clearly observed in the experimental tests. This could be due to simplifications of the numerical model, like using a 2-D axisymmetric model where the turbine was replaced with an actuator disk or the limited accuracy of two-equation turbulence models. It could also have resulted from the differences between the manufactured model and the numerical model: from the final geometry of the duct, to the actual physical supporting structures used for the duct, and the influence of the individual rotor blades (as opposed to a uniform disk) which affect the flow field. A third factor is the proximity of the ducted wind turbine to the floor. Since proper expansion would not have been possible to the extent of a turbine mounted far away from the ground, this may have aggravated the flow separation.
4.4 Final considerations
An argument could be made, and has been made to the authors, that rather than using a duct, one could simply increase the size of the rotor and accomplish the same increase in energy output, and this is absolutely true. In fact, the material required for the rotor would likely be less than that needed for the duct. For the case at hand, assuming the power is proportional to the area, all else being equal, one would need an increase of a factor of 2.7 times the area, from d=2.5 m (8.2 ft) to d=4.1 m (13.5 ft) or an increase in diameter of over 50 % – not an insignificant increase in the blade size, but certainly doable. Note that the duct exit diameter for the prototype was 3.3 m, 20 % smaller than the required rotor size increase would have to be.
In light of arguments such as this, it is important to highlight the additional advantages of a ducted turbine. First, for a given energy requirement, the DWT can be made smaller than an open rotor. Or stated in another way, for the same size rotor, the DWT would produce more energy. Second, one could utilize a lower tower to achieve the same AEP. Finally, and most importantly, is that a lower wind-speed regime can be utilized to provide the same energy when using a ducted turbine, and this is, arguably, the most significant factor, for it opens up many more areas to wind energy currently not even being considered.
From a design point of view, one significant cost and weight advantage is that a smaller generator can be used to achieve the same output AEP. A smaller generator also reduces the mast head weight and ease of installation, possibly alleviating the need for a crane. More subjective arguments, such as redundancy, can be debated, but if two turbines can produce the same amount of energy as one turbine and the cost is the same, the advantage is quite obvious. The current design uses a low-RPM generator, which helps alleviate noise issues, and the duct helps a bit in this area as well. Issues of ice throw from the blades can be mitigated with the duct, as well as blade throw, should a failure occur. Although a contentious topic, the impact on avian life can be argued to be lessened as birds can always see the duct and have even been seen to perch on the top of ducts in the past.
A final consideration is the key metric mentioned previously: cost per unit energy. Despite all the well-mannered intentions of those seeking a greener method of energy generation, it is this USD kWh−1, particularly over the life of the unit, also known as the levelized cost of energy (LCOE), that will be the defining factor for the ducted wind turbine. Whether or not a viable solution to this issue exists is a question that is still to be answered.
The primary conclusions of this study were as follows:
- 1.
The ability to predict the performance of a ducted turbine using a synergistic combination of a numerical flow field model as the input to a blade element momentum model was experimentally confirmed, suggesting that the numerical strategy can provide a means for a scalable design methodology.
- 2.
A prototype 2.5 m ducted rotor, with a ratio of the duct length to rotor diameter and to exit area of 0.25 and 0.19, respectively, was tested and exhibited the potential for generating twice as much energy as a conventional open rotor. Experimental Cp values, based on the rotor area, of 0.8 to 0.95 were measured, almost 3 times that of small commercially available turbines of the same rotor size.
- 3.
The use of a ducted turbine configuration can reduce the size of the required generator and the weight of the entire turbine at the mast head, leading to a reduction in the cost per kWh of the turbine.
The data plotted in Fig. 13 are the data available from this experiment. These data are available on request from visser@clarkson.edu.
KV designed the experimental apparatus and KV carried the experiments out. BK developed the model code and performed the simulations. KV prepared the paper.
The authors declare that they have no conflict of interest.
This article is part of the special issue “Wind Energy Science Conference 2017”. It is a result of the Wind Energy Science Conference 2017, Lyngby, Copenhagen, Denmark, 26–29 June 2017.
The authors would like to thank the many individuals who have contributed to
the project including Brian Helenbrook, Nojan Bagheri-Sadeghi, Paul Pavone,
Devon Jedamski, Steve McCauliff, Hebron Yam, Stuart Wilson, Cameron Gibb,
Alison Davis, Mike Valleau and of course Jacob Weller from the Clarkson
University machine shop facilities. We would also like to thank David Johnson from the University of Waterloo for the use of his facility
and the help of his students: Leif Falk, Michael McKinnon and Farid Samara.
Finally, we are very grateful for the funding support of this project from
the New York State Energy and Research Development Authority (NYSERA)
through NEXUS-NY.
Edited by: Jens Nørkær Sørensen
Reviewed by: two anonymous referees
Badawy, M. T. S. and Aly, M. E.: Gas dynamic analysis of the performance of diffuser augmented wind turbine, Sadhana, 25, 453–461, 2000.
Bagheri-Sadeghi, N., Helenbrook, B. T., and Visser, K. D.: Ducted wind turbine optimization and sensitivity to rotor position, Wind Energ. Sci., 3, 221–229, https://doi.org/10.5194/wes-3-221-2018, 2018.
Bergey Windpower: Bergey Commercial Website, available at: http://bergey.com/technical (last access: 13 December 2018), 2017.
Boston Globe: What went wrong with that weird wind turbine on Deer Island?, available at: https://www.bostonglobe.com/business/2017/05/05/deer-island-odd-looking-turbine-testament-failure/GJAe7yEYz1or8QGO07M95O/story.html, last access: 13 December 2018.
de Vries, O.: Fluid Dynmaic Aspects of Wind Energy Conversion, Advisory Group for Aeronautical Research and Development, AGARDograph No. 243, 3-5–3-8, 1979.
Foreman, K. M. and Gilbert, B. L.: Experimental demonstration of the diffuser-augmented wind turbine concept, J. Energy, 3, 235–240, 1979.
Foreman, K. M., Gilbert, B. L., and Oman, R. A.: Diffuser Augmentation of Wind Turbines, Sol. Energy, 20, 305–311, 1978.
Gilbert, B. L., Oman, R. A., and Foreman, K. M.: Fluid Dynamics of Diffuser-Augmented Wind Turbines, J. Energy, 2, 368–374, 1978.
Hansen, M. O., Sørenson, N. N., and Flay, R. G.: Effect of Placing a Diffuser around a Wind Turbine, Wind Energ., 3, 207–213, 2000.
Hu, S.-Y. and Cheng, J.-H.: Innovatory Designs for Ducted Wind Turbines, Renew. Energ., 33, 1491–1498, 2008.
Igra, O.: Shrouds for Aerogenerators, AIAA J., 14, 1481–1483, 1976.
Igra, O.: Reseach and Development for Shrouded Wind Turbines, in: European Wind Energy Conference EWEC84, Hamburg, Germany, 22–26 October 1984, 236–245, 1984.
Jamieson, P.: Beating Betz: Energy Extraction Limits in a Constrained Flow Field, J. Sol. Energy Eng., 131, 031008, https://doi.org/10.1115/1.3139143, 2009.
Jedamski, D. and Visser, K.: Computational Analysis of a Diffuser using USM3D for Diffuser Augmented Wind Turbines, in: 21st AIAA Computational Fluid Dynamics Conference San Diego, CA, USA, 24–27 June 2013, AIAA 2013-2966, 11 pp., https://doi.org/10.2514/6.2013-2966, 2013.
Kanya, B. M. and Visser, K. D.: The Impact of Airfoil Selection on the Design of Small Horizontal Axis Wind Turbines, in: 48th AIAA Aerospace Sciences Meeting Including the New Horizons Forum and Aerospace Exposition, Aerospace Sciences Meetings, Orlando, Florida, 4–7 January 2010, AIAA-2010-1583, https://doi.org/10.2514/6.2010-1583, 2010.
Leoffler Jr., A. L. and Vanderbilt, D.: Inviscid Analusis of Flow Around a Wide-Angle Diffuser with an Internal Actuator Disk, AIAA J., 16, 1111–1112, 1978.
Ohya, Y.: A Highly Efficient Wind and Water Turbines With Wind-Lens Technology & Offshore Floating Renewable Energy Farm, Summary Report, Kyushu University, Japan, available at: https://www.riam.kyushu-u.ac.jp/windeng/img/aboutus_detail_image/Wind_Lens_20140601.pdf, last access: 21 November 2014.
Ohya, Y., Karasudani, A., and Sakurai, A.: Development of High-Performance Wind Turbine with a Brimmed- Diffuser, Journal of the Japan Society for Aeronautical and Space Sciences, 50, 477–482, 2002 (in Japanese).
Ohya, Y., Karasudani, T., Sakurai, A., Abe, K., and Inoue., M.: Development of a shrouded wind turbine with a flanged diffuser, J. Wind Eng. Ind. Aerod., 96, 524–539, 2008.
Oman, R. A., Foreman, K. M., and Gilbert, B. L.: Investigation of diffuser-augmented wind turbines. Part II. Technical report, COO-2616-2, https://doi.org/10.2172/7105688, 1977.
Phillips, D. G.: An Investigation on Diffuser Augmented Wind Turbine Design, PhD thesis, University of Auckland, Auckland, New Zealand, 2003.
Politis, G. K. and Koras, A. D.: A Performance Prediction Method for Ducted Medium Loaded Horizontal Axis Wind Turbines, Wind Energ., 19, 273–288, 1995.
van Bussel, G. J. W.: The science of making more torque from wind: Diffuser experiments and theory revisited, J. Phys. Conf. Ser., 75, 012010, https://doi.org/10.1088/1742-6596/75/1/012012, 2007.
Venters, R., Helenbrook, B., and Visser, K. D.: Ducted Wind Turbine Optimization, J. Sol. Energy Eng., 140, 011005, Paper No: SOL-16-1123, https://doi.org/10.1115/1.4037741, 2017.
Visser, K. D.: Aft Rotor Slotted Ducted Wind Turbine, US Patent Submission, 15/355,859, 18 November 2016.
Werle, M. J. and Presz Jr., W. M.: Ducted Wind/Water Turbines and Propellers Revisited, J. Propul. Power, 24, 1146–1150, 2008.
Windpower Monthly: Vortec Energy collapses – economics questionable, available at: https://www.windpowermonthly.com/article/951478/vortec-energy-collapses, last access: 13 December 2018.